
20+ SEO Ranking Reports that Blow Away Clients
Some people start working with SEO thinking it’s a “set it and forget it” deal.
Just choose the right keywords, get the right backlinks, and BAM!
If only it were that simple.
In reality, you must exert a ton of effort to keep up with the ever-changing SEO landscape.
The best way to do this is with reports.
SEO reports provide valuable and perpetual insights into your website’s performance on search engines like Google and Bing.
Below we’ll show you how to use a rank tracker to generate 20+ reports to help you find areas where you can improve your search rankings and online visibility.
Let’s get started!
We’ll cover:
- The 20+ Rank Reporting Tools That Will Change Your Business Forever
- How to Create the Perfect Ranking Report for Your Clients
- Why SEO Rank Reporting is so Important
- Frequently Asked Questions About SEO Rank Reporting
- The Beauty of Unlimited Reports
The 20+ Rank Reporting Tools That Will Change Your Business Forever
To facilitate reporting, ProRankTracker provides more than 20 types of reports that you can customize for yourself and your clients.
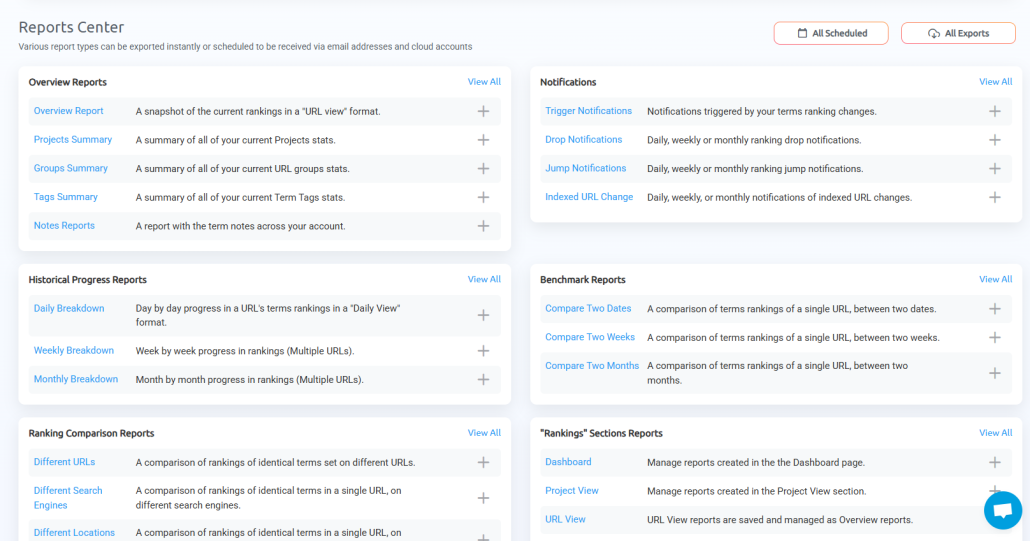
We’ll start with the main types of reports you can generate, move on to more advanced reports, and explain a bit about ProRankTrackers’s notifications system.
So, let’s begin the tour, shall we?
Overview Report
The first and most basic report is the Overview Report.
The Overview is the “bread and butter” report to give your clients a sound, broad-level understanding of their current ranks.
This report shows your change over the last:
- Day
- Week
- Month
As your clients scroll through the report (which you can send directly to their inbox from ProRankTracker), they’ll see a detailed look at their URLs and tracked keywords.
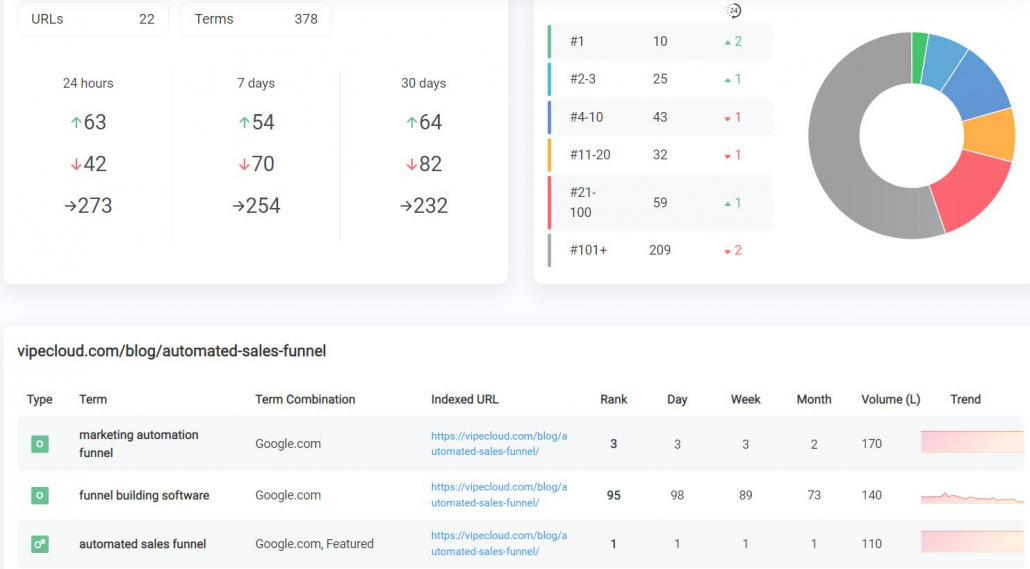
You’ll get an easy-to-understand breakdown of each URL’s rank, historical change, search volume, and ranking trends.
A report that you can’t customize is (almost) useless.
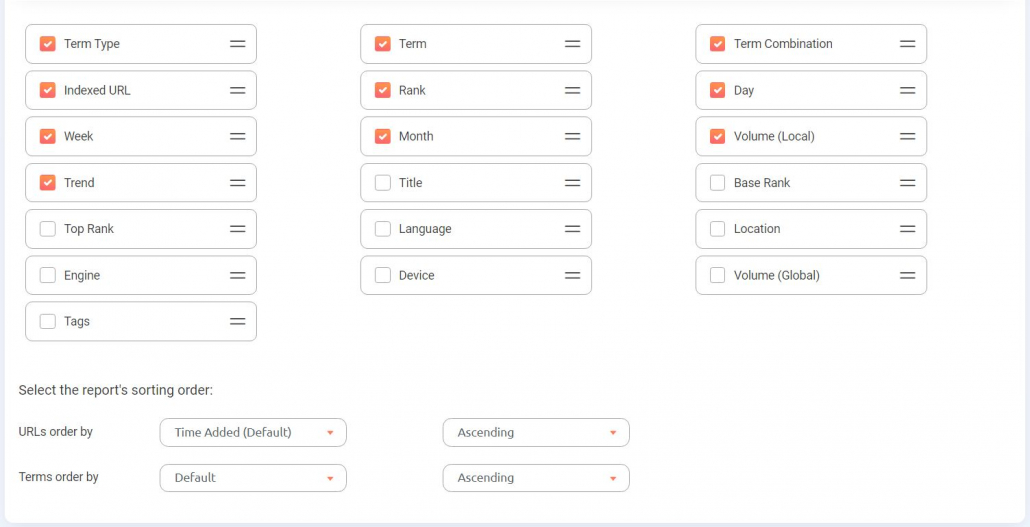
You can tailor this report any way you like.
For example, you can make the data table show every parameter available or go “minimalist” and deliver keywords and rank only.
Some clients prefer to see the ranks only, while others want an in-depth report with every parameter available.
When creating this report, simply select everything your client wants in their reports.
Projects Summary Report
The highest level of organization in ProRankTracker is the Project, which allows users to combine URLs, keywords, tags, and groups into a single organizational umbrella.
This is perfect for when you want to separate large numbers of URLs and keywords into more manageable chunks, for example:
- Different projects for each client
- A project for each physical store location
- Projects for different SEO campaigns
After you’ve generated multiple Projects, you may want to compare them to see how multiple Projects stack up to one another.
A perfect example of this is if you established a Project for each physical location you run. Comparing those Projects will allow you to see if one of your locations is lagging behind the others in SEO.
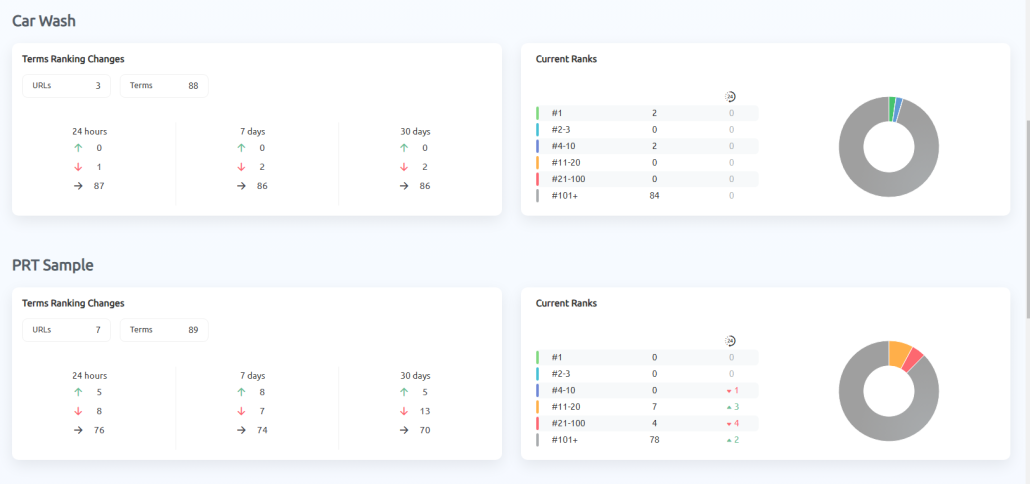
The Projects summary report shows a broad overview of multiple projects, allowing you to quickly compare them before using other reports to get a more detailed look.
Groups Summary Report
In ProRankTracker, you can organize your tracked URLs into groups.
You can later filter out all the URLs that belong to a specific group — this allows for quick navigation, and it’s a great way to keep your account organized when working with multiple clients.
The Groups Summary Report generates a quick summary of all your defined groups.
You can, of course, select which groups are shown in this report.
This report is more straightforward than the Overview Report and includes significantly less data.
The Groups Report shows high-level information about an entire group of URLs rather than details about each individual URL.
These reports can also be immediately downloaded as a PDF, CSV, or XLSX file or emailed and shared via Dropbox or Google Drive.
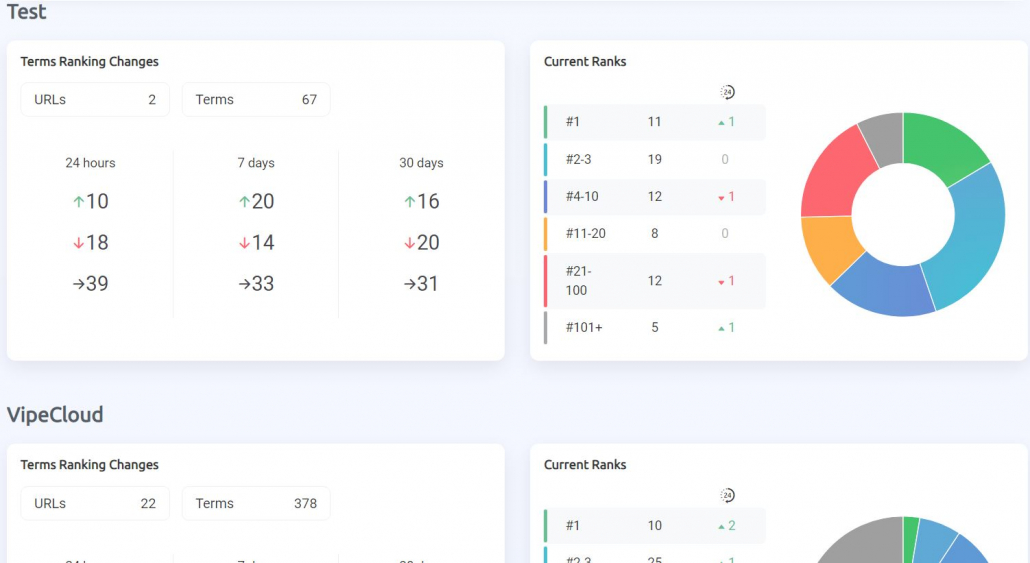
They provide a general outlook while showing whether a particular client’s ranks are trending up or down.
Tags Summary Report
In ProRankTracker, tags function identically to Groups but are assigned to tracked keywords instead of URLs.
The Tags Summary Report is similar to the group summary report but summarizes tags instead of groups.
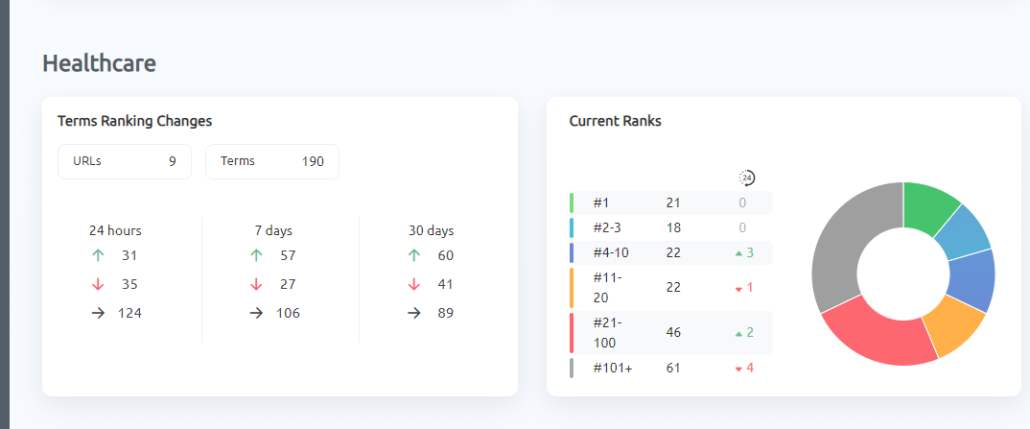
Like in the Groups Report, you can choose which tags will appear in the report and how you want to export the data.
Notes Report
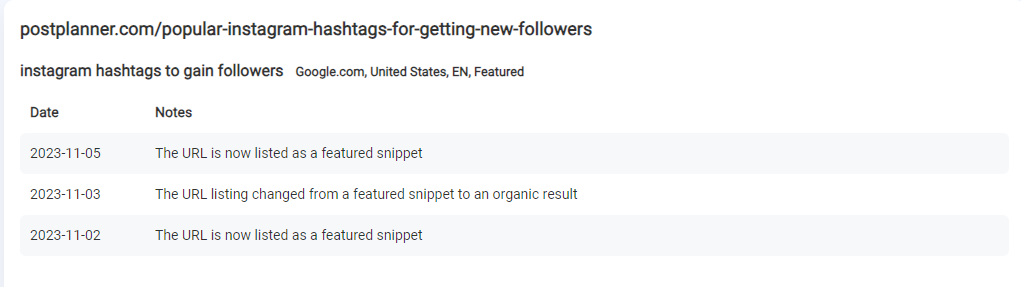
ProRankTracker automatically generates notes when a URL or keyword undergoes a significant change.
For example, notes will be generated if an indexed URL is changed, and when it’s in/out of the featured snippet.
You can also manually add notes of your own to help you track significant developments. For example, you could add a note to help you remember what on-page changes you made that led to a rank jump or drop.
It can be challenging to keep track of these critical developments, and that’s where the Notes report comes in.
This report allows you to track these notes so you can see precisely how each of your URLs’ ranks has changed over time.
Daily Breakdown Progress Report
This report is similar to tracking stocks on the stock market.
First, the top of the report gives you an overview of how each of the keywords for a specific URL has performed in the last month (or whatever date range you specify).
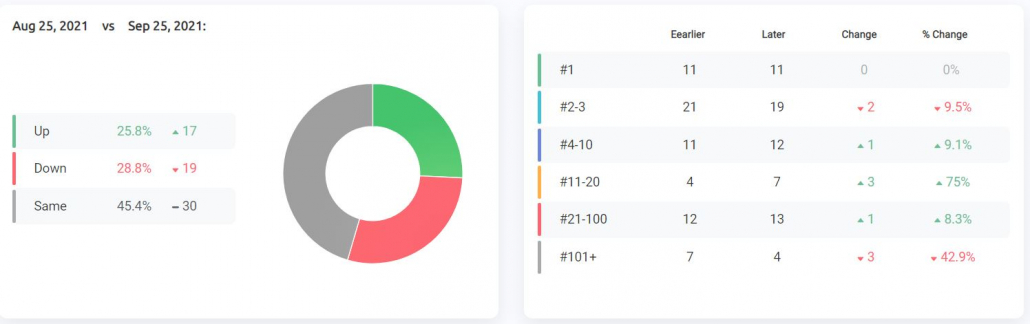
As you scroll down, it shows the daily progress specific keywords have made in a detailed chart for each keyword.
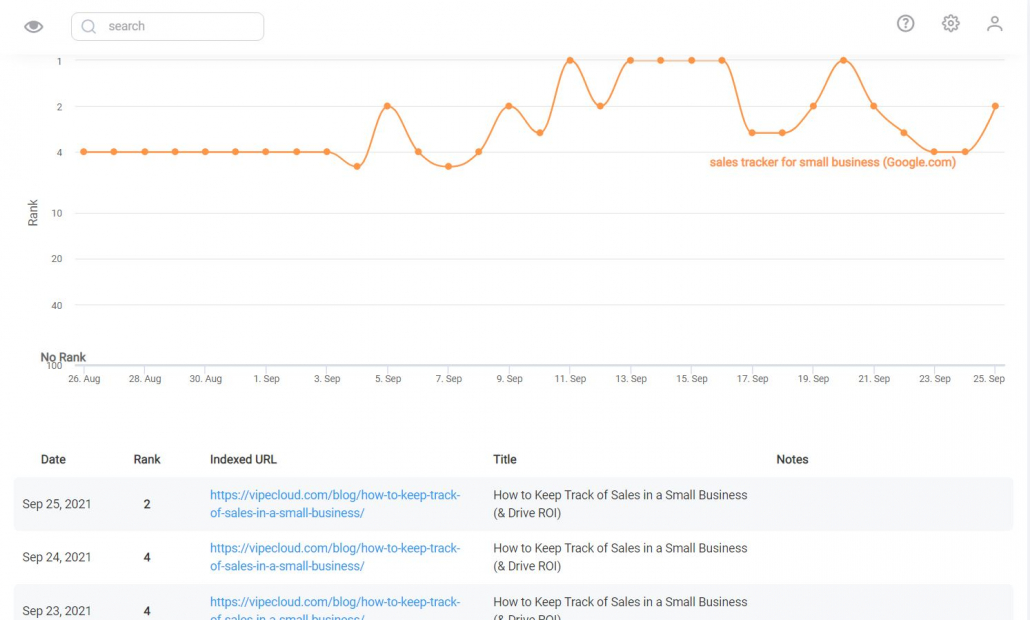
You can make the graph show any period by defining a date range.
This report is also great for creating case studies of success stories to showcase to potential new clients.
For example, you can demonstrate how you took a website that initially struggled, not even in the top 100, to ranking in the top 10.
Using this report, you can overlay how a keyword ranks on different search engines or Google domains (such as Google.com.au).
The Daily Breakdown report is essential for understanding how a URL’s keywords progress over time and comparing that data between search engines and devices.
Weekly and Monthly Breakdown Reports
The Weekly and Monthly Breakdown Reports function precisely like the daily breakdown but as a “zoomed-out” version.
This report allows you to make comprehensive periodic reports showing change over weeks or months.
The top of the report shows a pie chart of the changes for the selected URLs, alongside more detailed information about your keyword rankings.
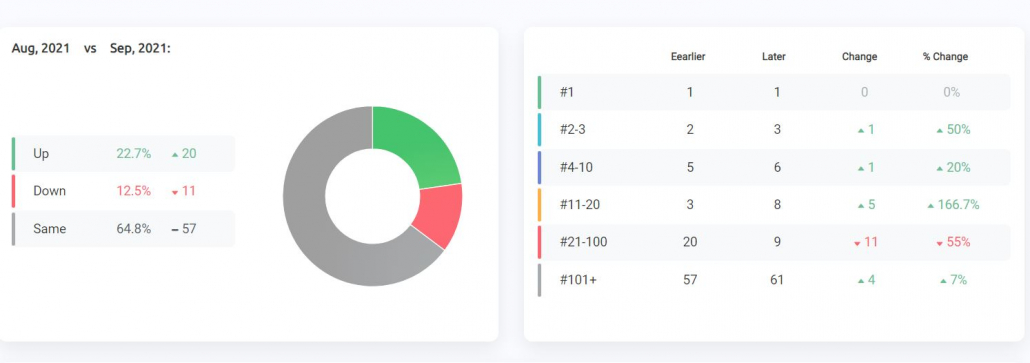
As you scroll down, you’ll see graphs for each tracked keyword.
On the “zoomed out” Weekly and Monthly Reports, each chart shows each week’s or month’s top, bottom, and average positions.
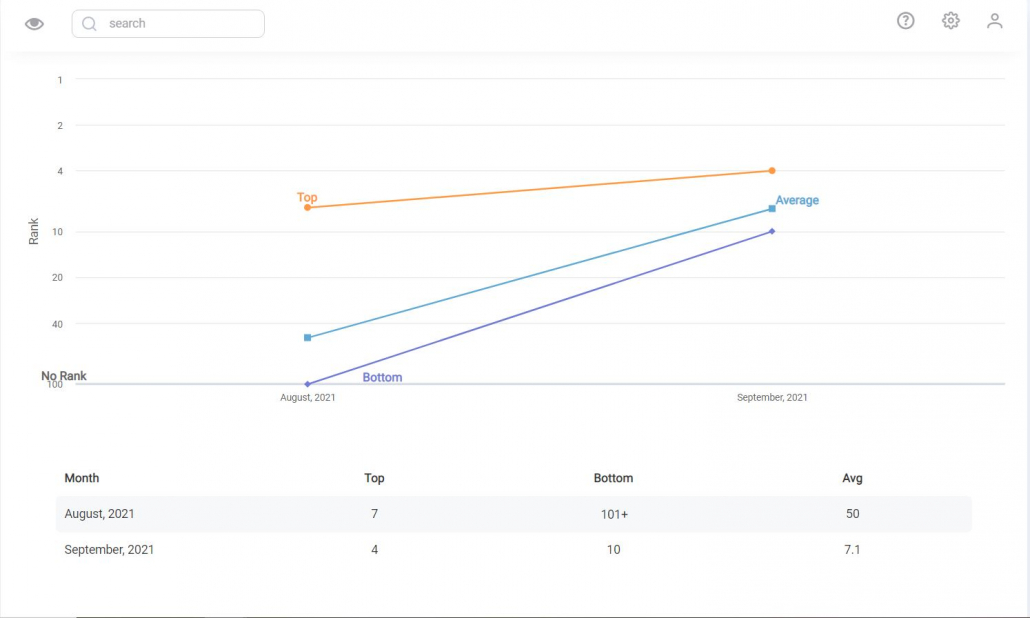
You can add comments to your generated PDF as with the other reports.
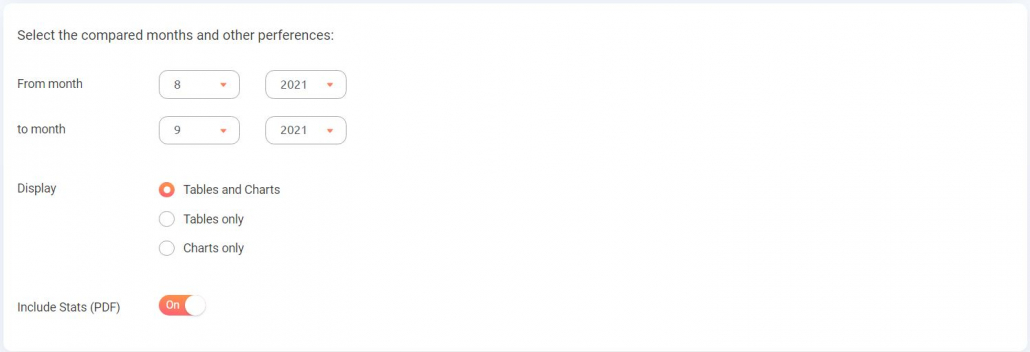
The Weekly and Monthly Reports are easy to generate with specific dates.
Select the range you’d like to see by choosing “from” and “to” dates, then select the URLs you’d like to view.
Not every campaign will immediately start showing results.
Most will likely take a few weeks before your clients begin noticing any real changes.
Since specific campaigns might take a while before they bear fruit, these types of reports allow you to show your clients long-term progress.
Different URLs Report
This report compares the current ranks of the same keywords among different URLs.
There are 2 super cool ways to use this report:
- Competitor analysis
- Refinement of your campaign
By seeing how two URLs rank for the same keyword, you can determine which page performs better (whether that’s a comparison between competitor pages or two of your own pages). Then, use that information to refine your campaign and improve your keyword targeting.
To generate this report, select the URLs competing for the same keyword and then select the keywords to compare.
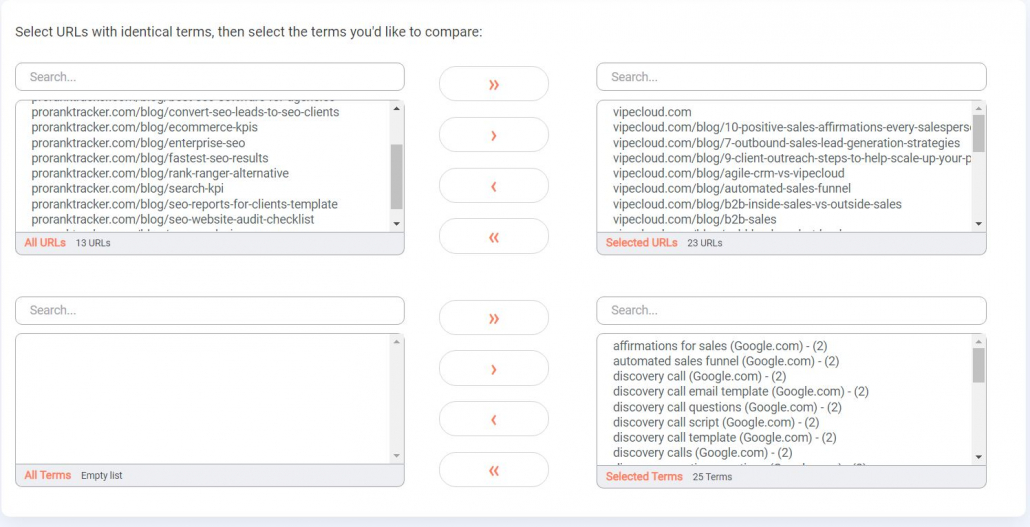
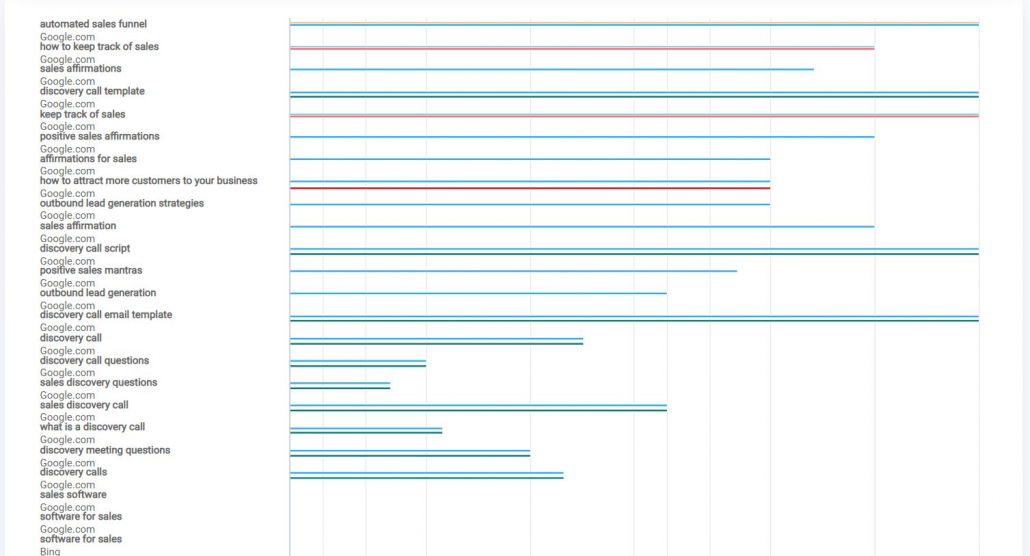
When you generate this report, the first thing you’ll see is a graph comparing the performance of each URL for each keyword.
In our example, we’re comparing more than 20 keywords, but you can choose to compare as many or as few as you want.
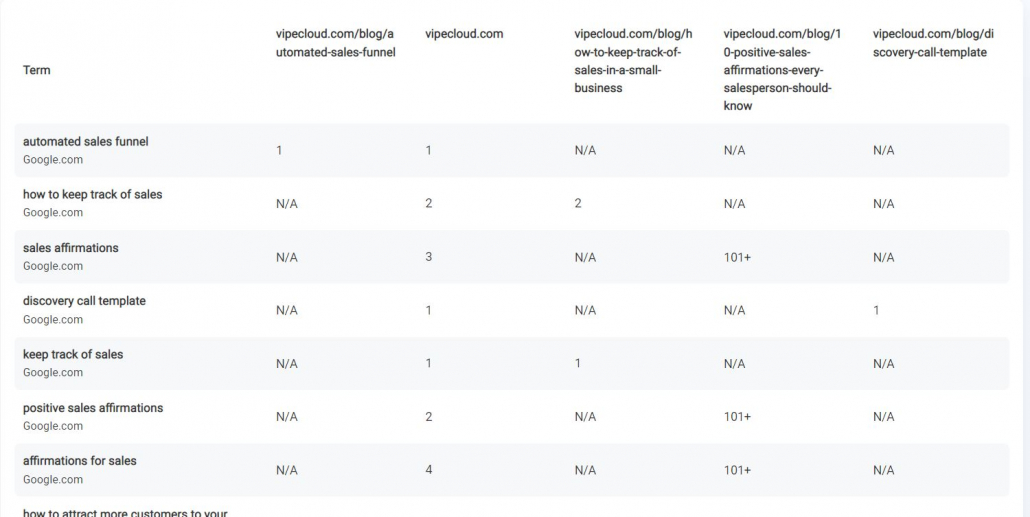
As you scroll, you can see a chart that displays a more specific comparison of the URLs and their keywords.
Once the report is generated, it remains active (unless you delete it), so you can check it whenever you’d like.
Different Search Engines Report
This report lets you see how well specific keywords are doing among the different search engines (Google, Yahoo!, and Bing).
Unlike some of the other reports, this report compares CURRENT ranks instead of presenting a historical graph.
The primary purpose of this report isn’t to give an overview but to provide detailed insight into how you’re performing on various search engines.
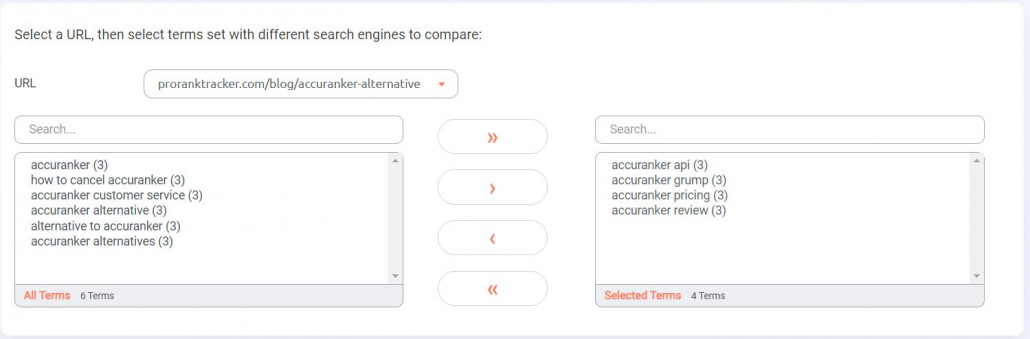
Select a URL and choose your keywords to compare across multiple search engines to generate this report.
NOTE: You have to be tracking multiple search engines for a keyword for it to be eligible for this type of report. You can add tracked search engines to a keyword in the Add Wizard or Advanced Add, or you can add them later by editing your tracked keywords.
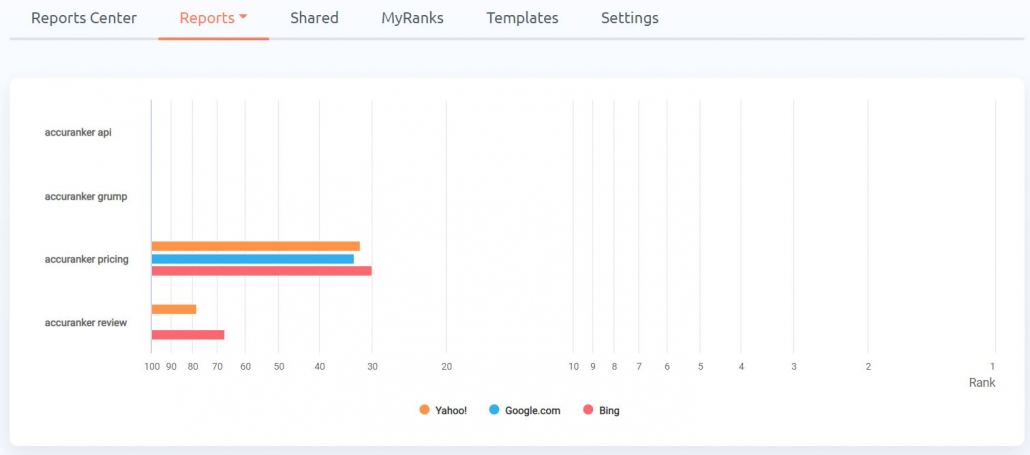
The chart generated by this report stacks your performance on each search engine on the same graph.
This presentation makes it easy to compare your performance quickly.
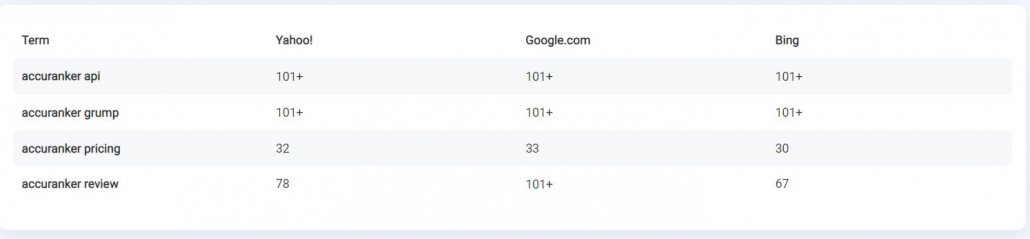
You can also scroll down to see the same information in table form instead of as a chart.
Again, once the report is generated, it remains active (unless you delete it), so you can review it as frequently as you like.
ProRankTracker will update it daily.
Different Locations Report
The Different Locations Report is ideal for businesses that want to improve their local SEO.
When local businesses add URLs for tracking in ProRankTracker, they should also add specific location data.
This report will compare how your keywords for a particular URL are performing in different locations.
To generate this report:
- Select the URL you’re tracking in multiple locations.
- Select the keywords to compare from the list
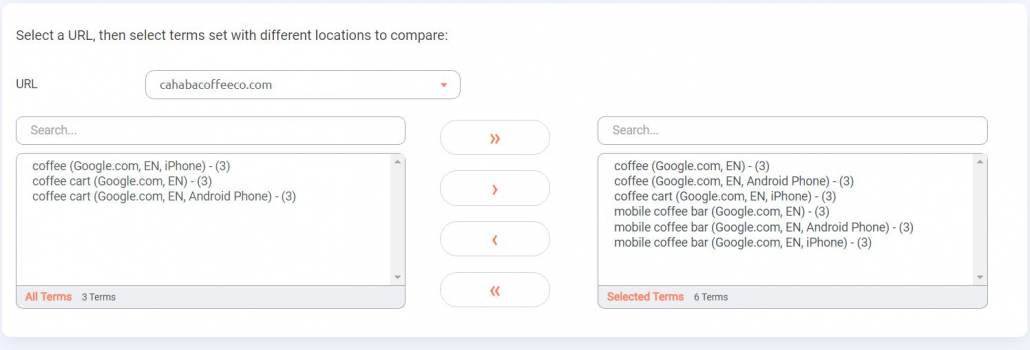
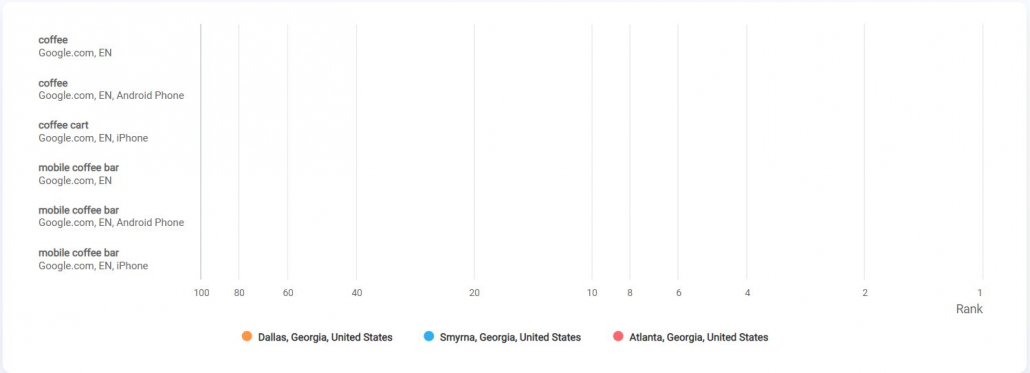
The report plots your ranks from each location on the same graph. This handy feature provides a performance comparison of several target areas.
Different Devices Report
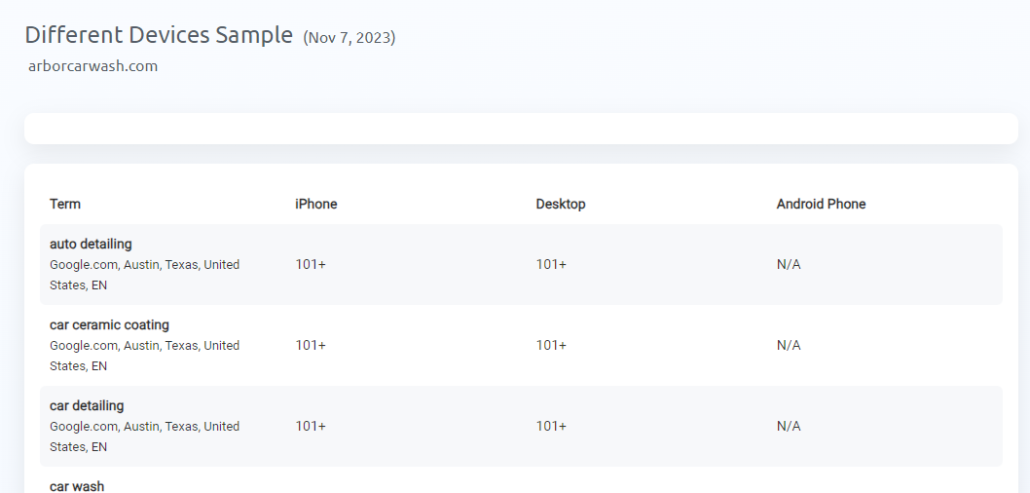
The Different Devices Report functions similarly to the Different Locations Report but plots performance across different device types instead of locations.
You can compare your performance on:
- Desktop
- Android mobile
- Apple mobile
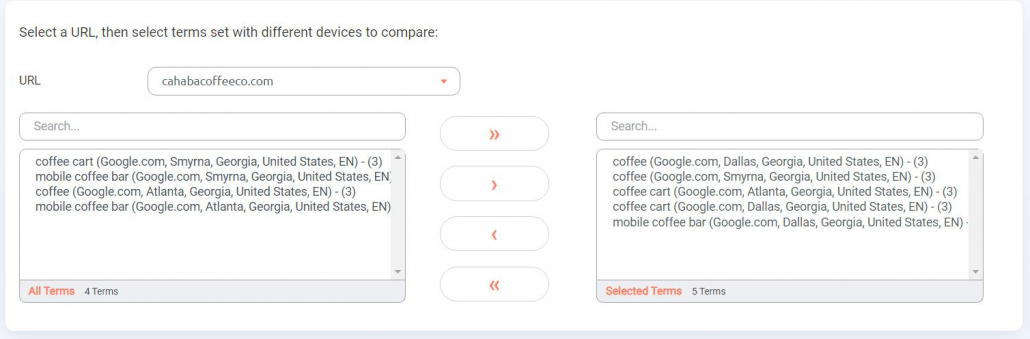
You generate this report in the same way:
- Select the URL to track across multiple devices.
- Choose the URL for which you want to generate a report.
- Select the keywords to plot on your graph.
The report will stack your keywords’ performance for different devices on the same graph.
People often underestimate the importance of local searches and understanding how your terms rank on mobile vs. desktop.
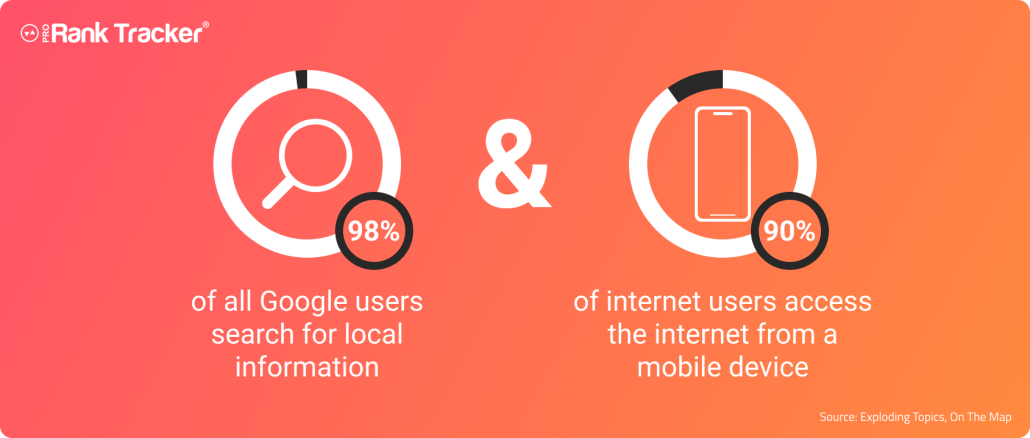
Don’t forget 98% of all Google users search for local information, and roughly over 90% of internet users access the internet from a mobile device.
Translation — you CAN’T ignore these two important reports!
They’ll keep you updated on how you’re performing across different locations and devices.
Benchmark Reports
The benchmark report is another excellent report for capturing a wide-angle view.
There are 3 different benchmark reports:
- Compare 2 dates
- Compare 2 weeks
- Compare 2 months.
We’re talking about these 3 reports together because they each function in the same way.
This type of report allows you to compare all the ranks for a specific URL between 2 selected days, weeks, or months.
In other words, you can use 1 day, week, or month as a “benchmark” to help analyze how your rank changed between that selection and a later selection.
Using this report, you’ll grasp the big picture of a specific campaign performance over a given period.
For example, let’s say you track 32 keywords for Goodreads.com.
In a single, unified report, you’ll see the total changes for all 32 keywords between the 2 dates or periods.
You’ll see which terms rose, which flopped, and which held steady.
Let’s look at these 3 reports to see how they work.
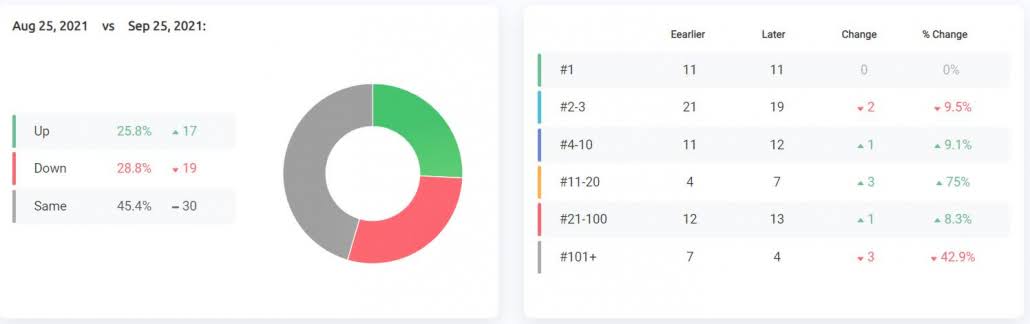
Here’s a comparison between September 25 and the same day in the previous month — this will give us a good idea of whether a URL is trending up or down.
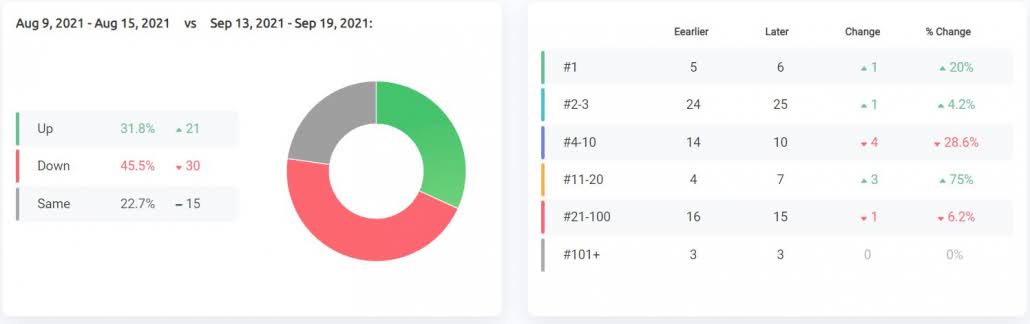
Here’s the same URL, but it compares the first week of August and the first week of September.
This report will give us a good idea of the overall performance of the URL across the 2 months.
If most of our ranks dropped in September, there’s probably an issue to address.
Here’s a final report showing August of 2020 vs. August of 2021.
Seeing a month-to-month comparison like this will help you track and understand seasonal trends and fluctuations and assess your long-term performance.
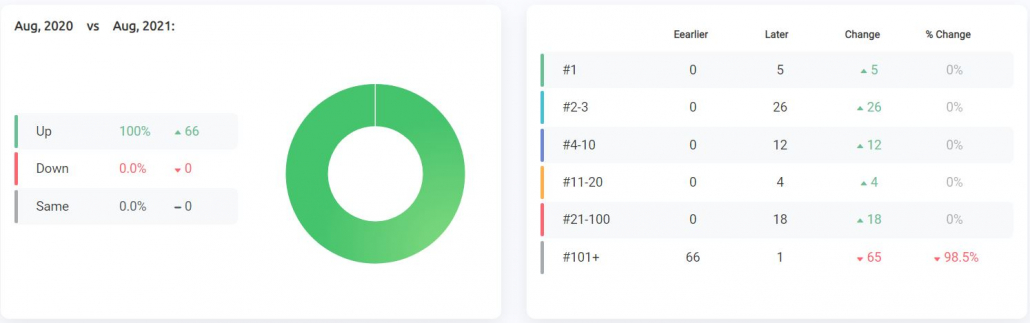
If your graph is all green like this one, all your keywords have improved!
Presenting a chart like this to a client can help improve customer loyalty over time by showing them the effectiveness of your SEO services.
The data is also represented in a table that shows the top or average position for the 2 periods you chose to compare.
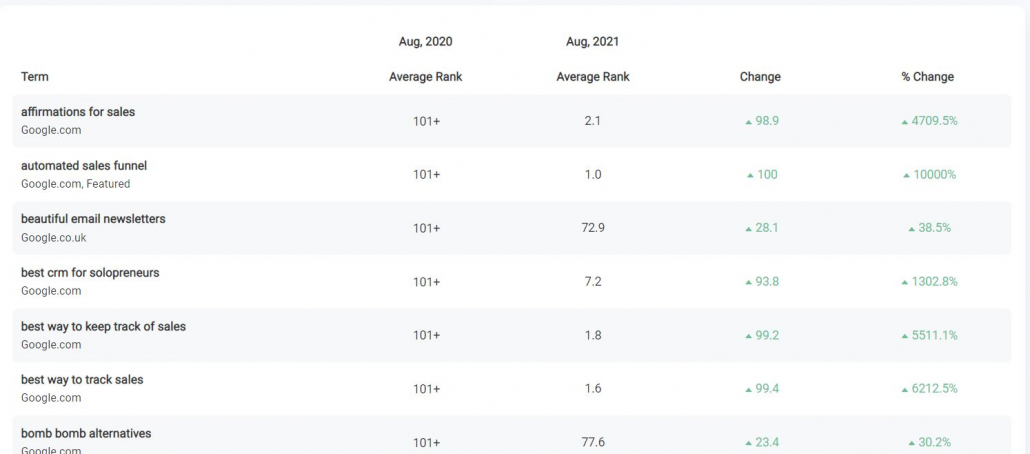
In the examples above, you can see that in the specified period, some keywords rose in rank, some dropped, and others remained the same.
This is also an excellent report to include in a case study to see how successful a campaign has been over time. You can also show how a competitor dropped in ranks by comparison as the cherry on top.
“Rankings” Sections Reports
There are 6 total different Rankings Reports.
Each Ranking Report corresponds to one of the 6 basic “Views” at the core of ProRankTracker’s functionality:
- Dashboard
- Project View
- URL View
- Term View
- Daily View
- Full SERPs
Generating a Rankings Report transforms any of these 6 views into a customizable, brandable PDF report to send to your clients.
Let’s quickly look at each of these 6 reports.
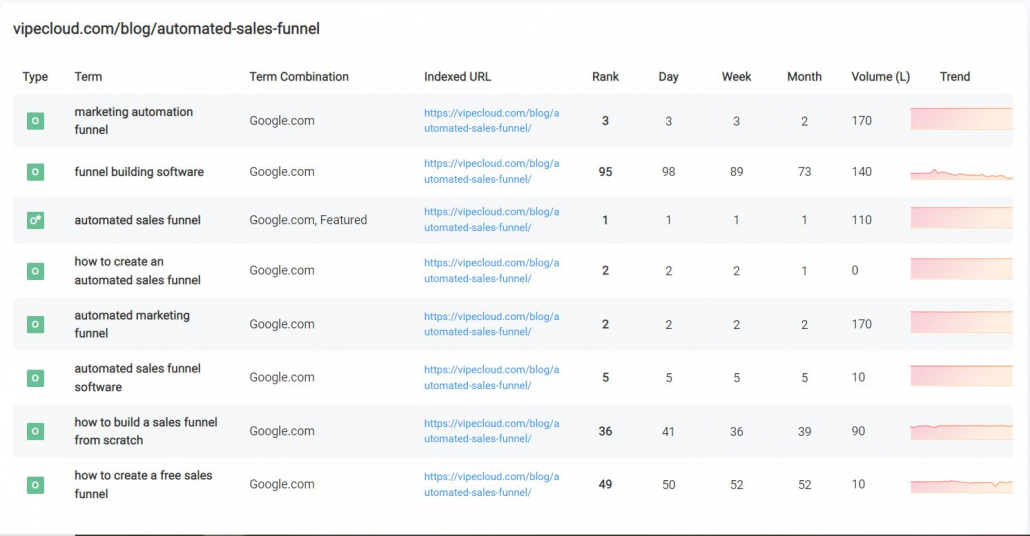
1. URL View Report
The URL View Report functions precisely like an Overview Report — you can even create it from the same page.
When creating an Overview Report, just tweak the settings and filters until you’re happy with them.
In other words, the Overview Report and the URL View Report are identical, but you can use filters and settings to make the report more or less detailed than your URL View page.
2. Project View Report
The Project View report lets you generate a snapshot view of one of your active Projects.
Generating a Project View of an entire Project includes a breakdown of all the URLs in that Project.
If you generate this report for a Project and specify the URL you want to analyze, it includes more detailed information, such as the heatmap, progress graph, and other valuable aspects of the Project View.
To generate this report, select the Project you want to review. If you’re working with a client, you would simply choose the Project that contains their data.
It’s important to note that the Project View report only shows ONE Project in each report. If you want to compare multiple Projects in a single report, you need to use the Project Comparisons report discussed above.
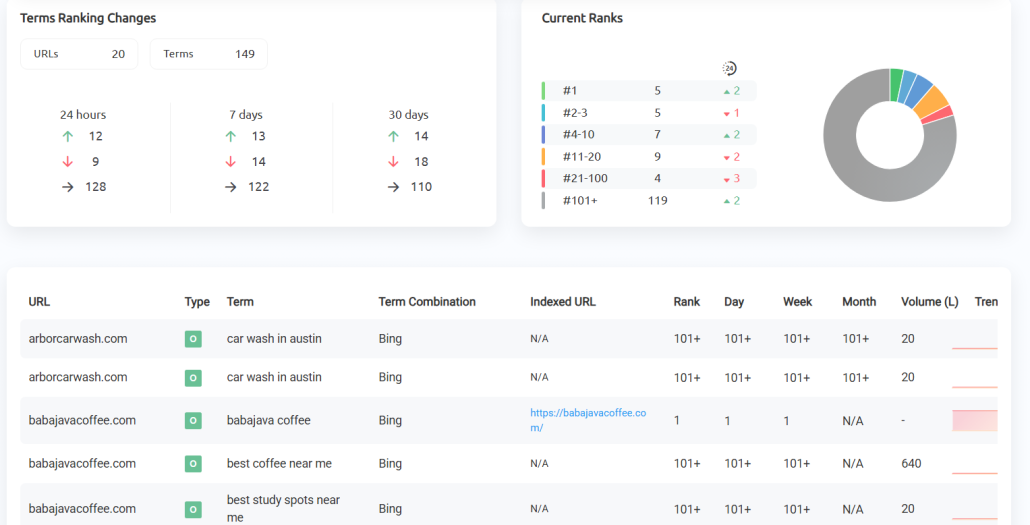
Use Project Reports to help your clients understand how their entire SEO strategy is performing, and then use other reports to provide more specific details.
3. Term View Report
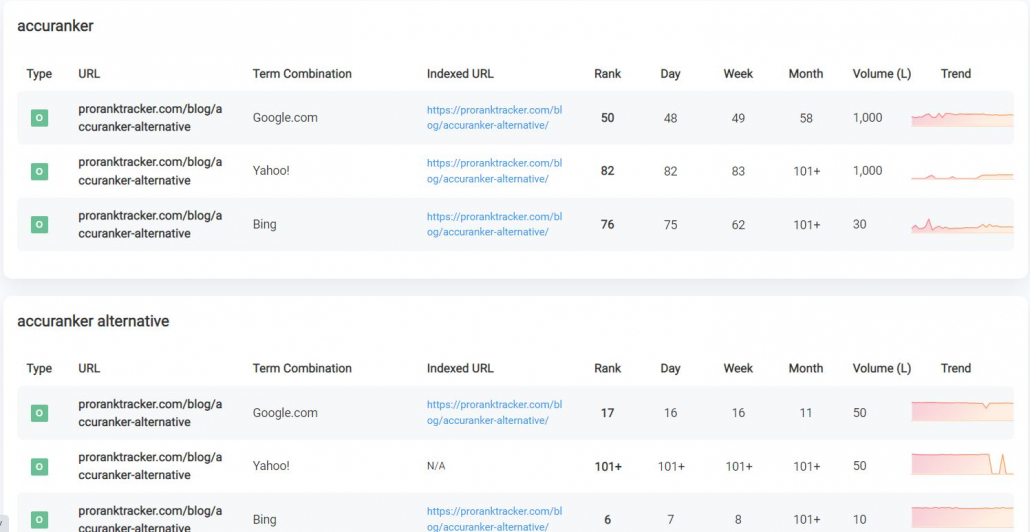
The Term View delivers a snapshot of all your keywords’ ranks daily.
It breaks down each keyword by the URLs targeting that keyword, giving you insight into your keyword’s performance across multiple pages.
4. Daily View Report
The Daily View Report is identical to the Daily Breakdown Report.
Similar to the relationship between the Overview Report and the URL View Report, the info included in your report depends on how you tweak the settings.
The Daily View Report and the Daily Breakdown Report give you a day-by-day report of specific keywords’ performance.
Use the settings and filters to include more or less info, depending on your heart’s desires.
5. Dashboard Report
Your dashboard report gives you the broadest range of info about a campaign’s health.
If your clients aren’t particularly interested in details but still want to stay up to date on overall ranks and changes, the Dashboard Report will be your go-to.
The Dashboard Report includes:
- A 24-hour, 7-day, and 30-day change graph
- A current ranks graph
- Biggest rank jumps or drops in the last 24 hrs
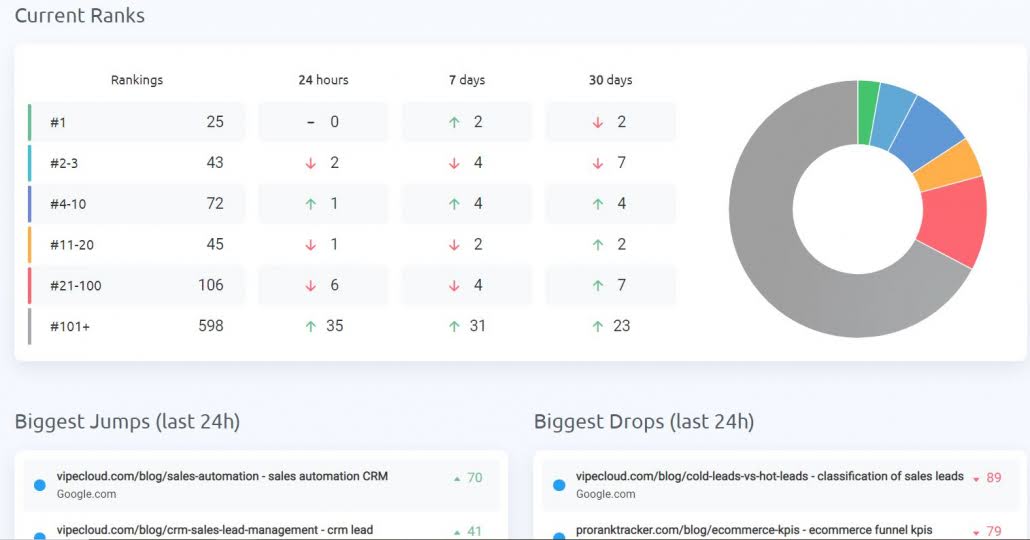
The Dashboard Report is similar to the Project View Report in that it gives high-level details, but it doesn’t include the more granular information that the Project View Report includes, such as the URL breakdown and the daily change graph.
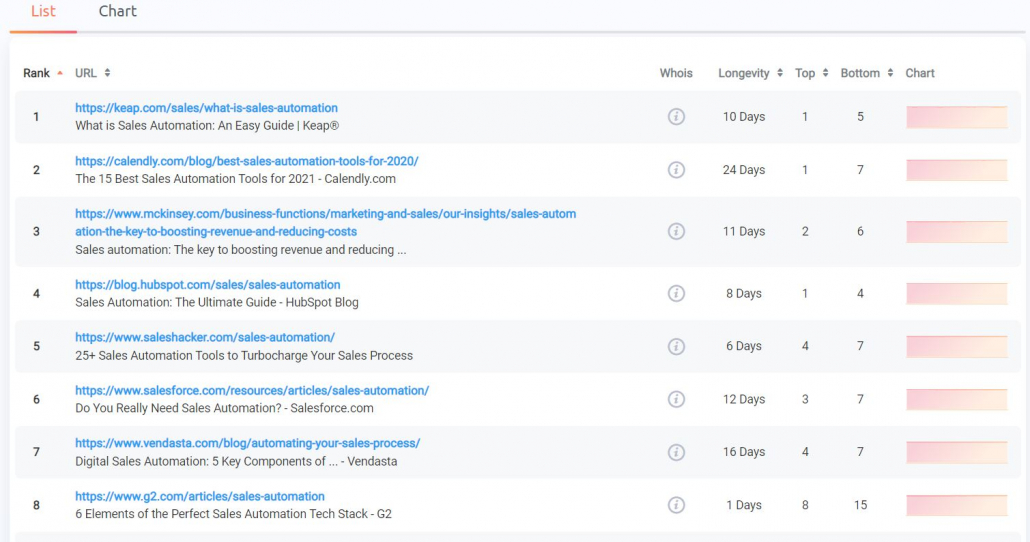
6. Full SERP Report
The Full SERP shows you the entire search engine results page for a specific keyword.
To generate a Full SERP Report, select the desired URL and keyword and the date range you’re analyzing.
ProRankTracker will generate a report showing the SERP for that keyword, making it easy to monitor your competitors’ keywords and monitor your own performance.
We’ve covered the big 6 reports, but ProRankTracker also offers several SEO reporting tools that take these reports to the next level.
Let’s look at some cutting-edge reporting features that’ll change your understanding of your SEO.
Scheduled Reports
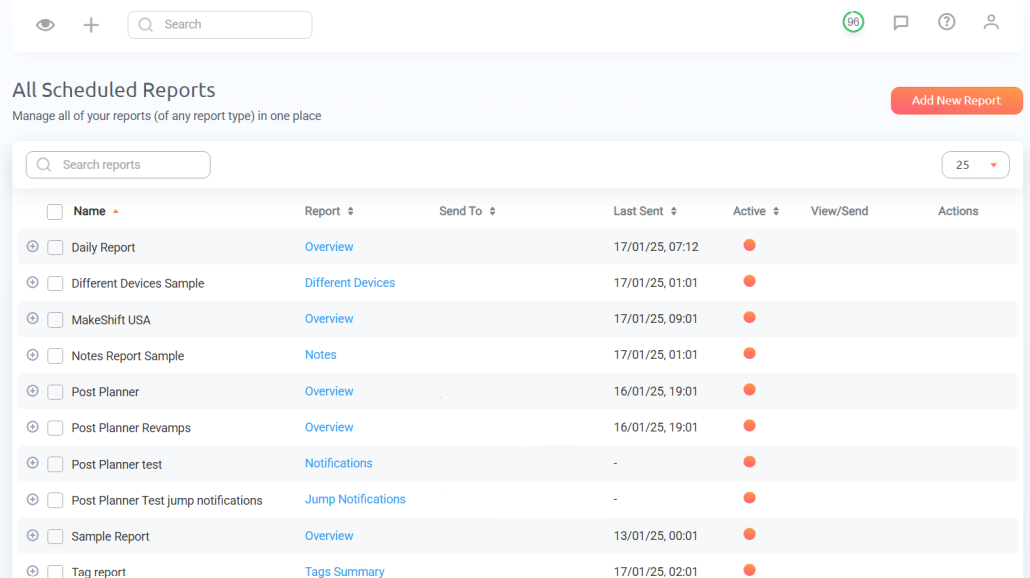
ProRankTracker also offers Scheduled Reports.
You can schedule almost any report in advance to be generated daily, weekly, or monthly.
They’re fully customizable and downloadable like all other reports.
Another customization feature ProRankTracker offers is the ability to customize the email address from which the report is sent to your clients.
This makes you look like a pro.
Scheduled Reports are a fantastic way to keep your clients up-to-date daily on their campaign’s progress while saving you time through automation.
Smooth communication = happy, in-the-know clients.
Notifications
Notifications are similar to Scheduled Reports, the sole difference being that these aren’t sent on a consistent schedule.
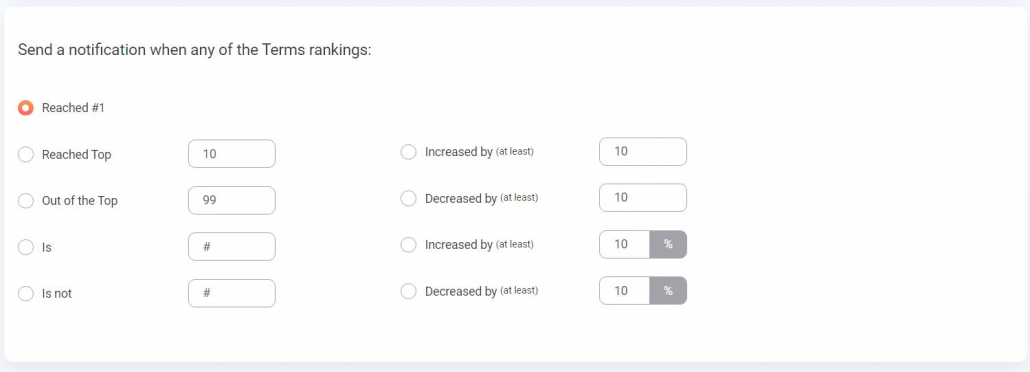
Instead, notifications are sent when a goal is reached, like nabbing the top position on the SERP.
In other words, a Scheduled Report could be sent on the first Monday of every month, whereas a notification might only be sent when a URL drops 5 ranks for a specific keyword.
Once a pre-set trigger occurs, a report will be sent to preassigned emails or your Dropbox or Google Drive.
You’re entirely in control of what triggers a notification and what information that report includes.
Some potential triggers might be:
- When your keyword hits the top position on a SERP
- When you get into the top 10 for a keyword
- When a keyword increases or decreases by a set number of ranks
- When a keyword hits a specific rank of your choosing
This is one of the most valuable reporting features for an SEO campaign because you can use Notifications as strategy signals to determine what’s working and what’s not.
For example, the last thing you want is an important keyword to drop ranks without noticing. Notifications fix that issue without breaking a sweat.
Likewise, it’s great to be notified when a keyword reaches a particular milestone, such as entering the top 10.
If your keywords are in the top 10, you may then choose to focus your efforts elsewhere.
Shared Reports
Instead of the traditional avenue of emailing a PDF, the Shared Reports feature creates an interactive web page with the report data.
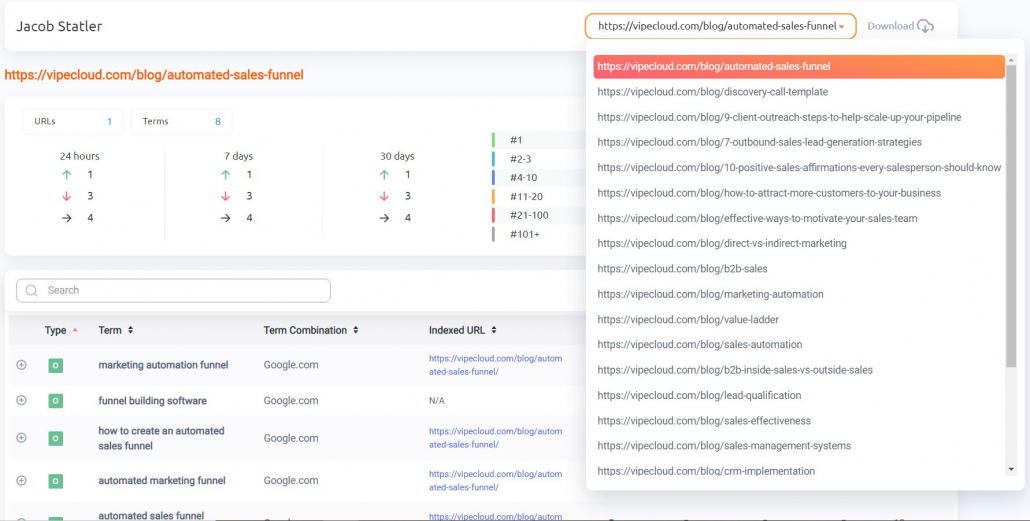
- All data shown on the page is fully customizable. The report offers an overview of all term changes and includes a data table showing your chosen fields (rank, SE, search volume, etc.). The displayed data consists of all terms associated with a URL or a group of URLs.
- The generated link is unique and can even be encrypted with a password so only the people you choose can see it.
- You can set the link to expire in a certain amount of days.
- You can share your Projects with clients as a Shared Report, meaning they can access their Project data in an interactive webpage with daily updates.
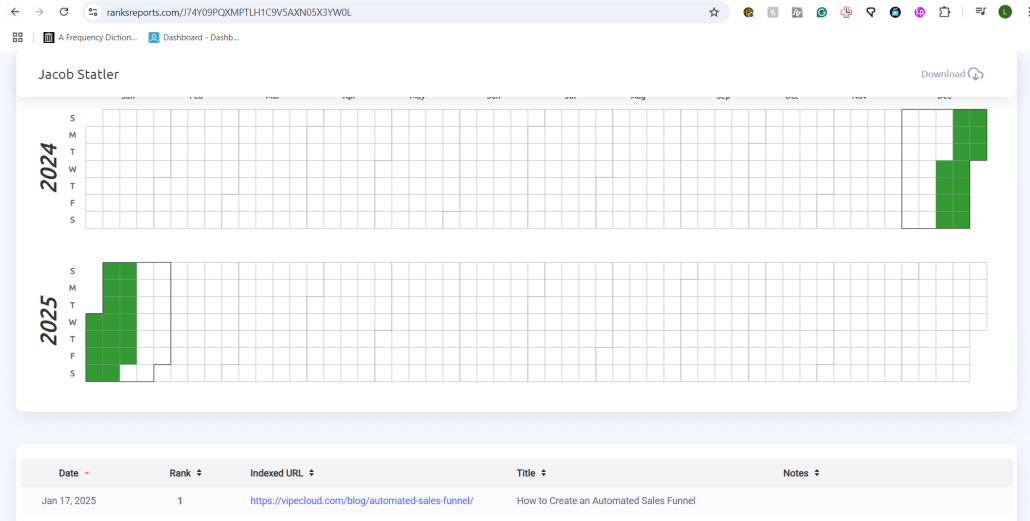
- You can also allow the person viewing the page to download the data as a PDF, CSV, or XLSX file.
- This web page is updated daily — the person you share it with doesn’t need to be a PRT user and only needs access to that link to view the freshly updated data.
- This feature is entirely white-label. You can generate a link with YOUR domain as the URL and your logo, design, and details embellishing the shared report. PRT remains hidden and acts as your backstage power and infrastructure. (You rake in all the credit!).
This feature will impress your clients and help more hands-on clients feel like they’re up to the minute on their SEO progress (because they will be).
MyRanks Client App
Here’s where it gets cool:
You can have your own SEO mobile app!
ProRankTracker offers access to a fully white-label mobile app called MyRanks, allowing your clients to get rank updates right on their phones!
Utilizing MyRanks creates a “2-birds-with-1-stone” scenario…
It reassures your clients that their case is a top priority. They can also check the app for progress updates on their SEO campaigns.
MyRanks has features like:
- The app is available for iOS and Android.
- YOU choose what data you want the users to see — share a single URL or a group of URLs. It’s up to you.
- The data is always fresh and updates live.
- The person viewing the app can download the data as a PDF, CSV, or XLSX file to their mobile device.
- This app is 100% white-label and can (and should) be embellished with your logo and company details. PRT works for you behind the scenes. You can quickly design the white label customizations for MyRanks through PRT Settings.
- Set up a username and password for your clients, colleagues, or boss, and they can download the app through the App Store or Google Play.
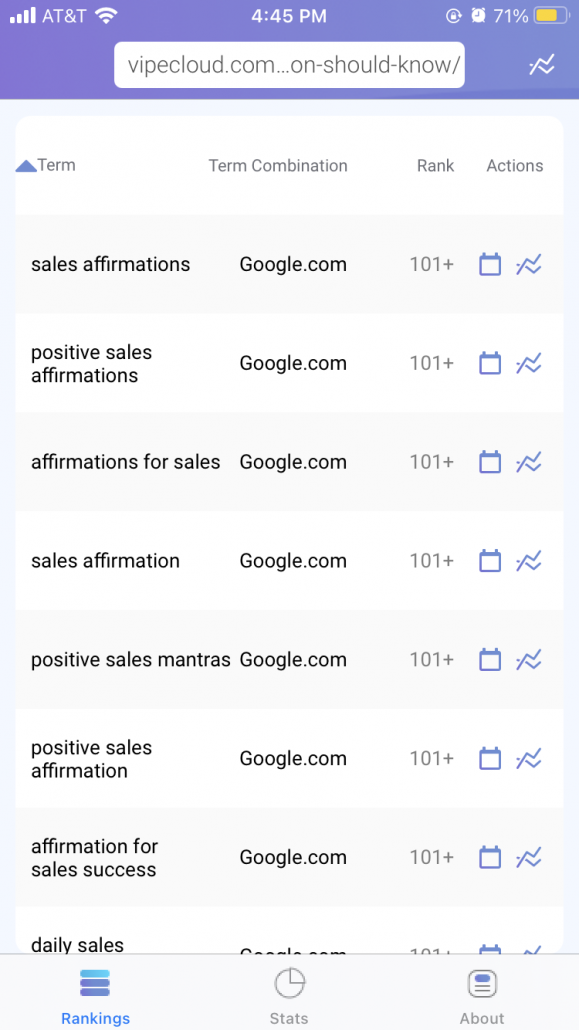
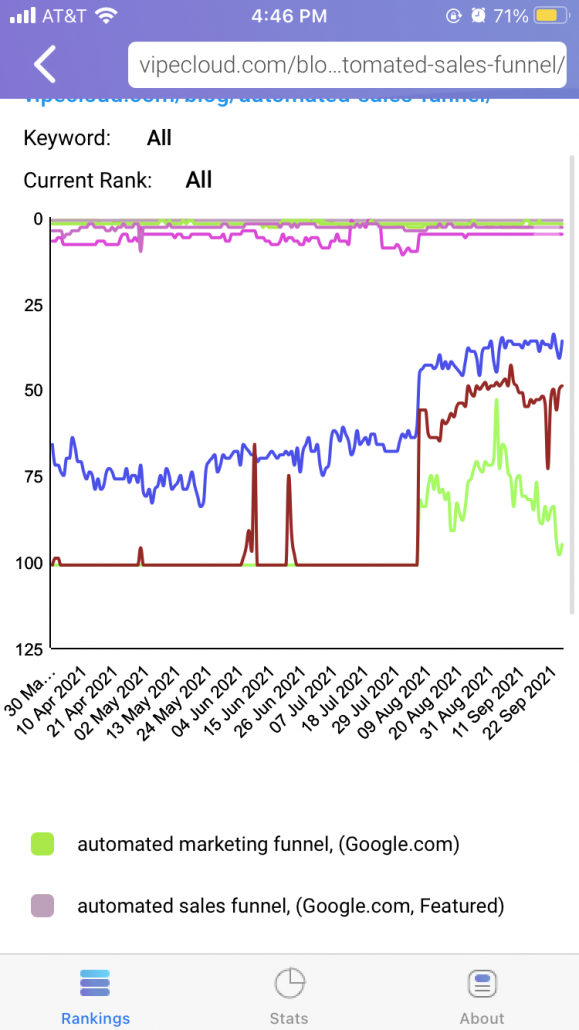
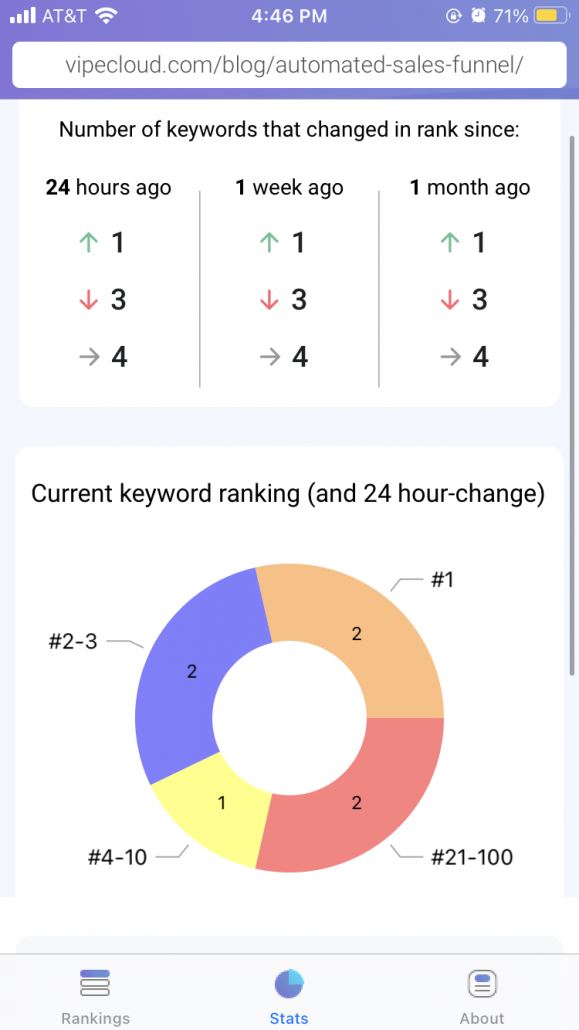
Showcasing MyRanks is another way to increase your perceived value among clients.
Users
With Users, you can set up smaller ProRankTracker permission-based user accounts with unique usernames and passwords.
You’ll manage these under your main account, giving access only to the specified data you have in ProRankTracker.
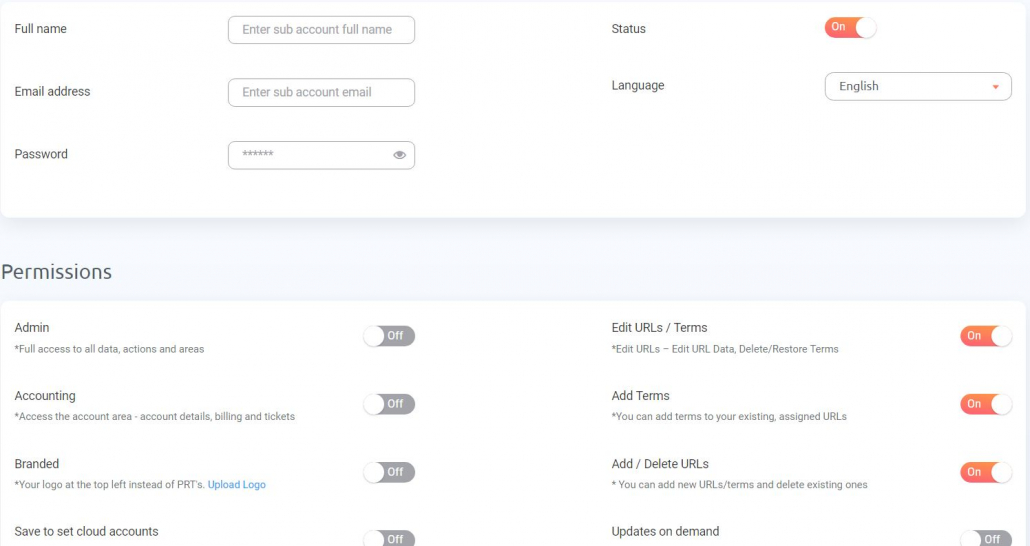
Every user account can also have your logo and other white-label options.
Give colleagues or clients access to a user account with their own username and password, and the logo they’ll see will be YOURS.
You can specify the data seen by each user. Adjusting various permission levels lets your clients view limited data or have full access and admin control over all data.
In addition to impressing clients, it’s an excellent organizational solution for distributing workflow to your team and colleagues and delegating tasks.
Each campaign can have its unique user account associated with it.
Templates
PRT values customization, as already mentioned throughout this post.
Let’s quickly go over how the customizing templates option works on PRT.
When you open the templates menu, you’ll see different options, including:
- Colors
- Headers and footers
- Cover letters
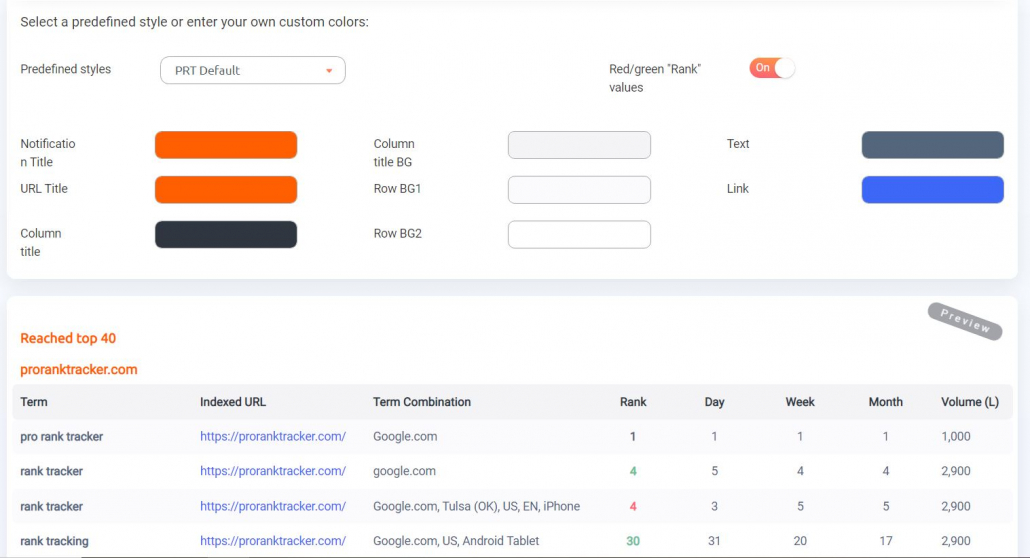
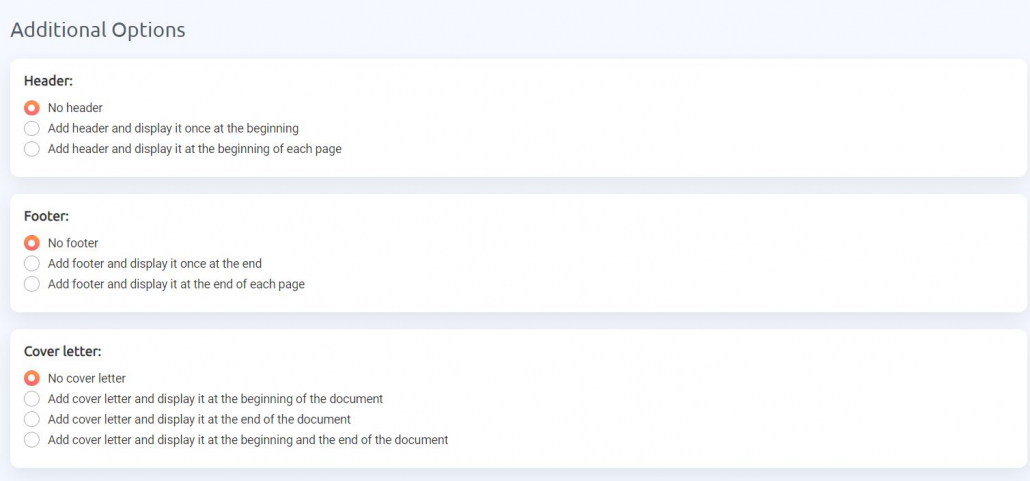
When you’re done customizing the template, just name it and save it.
Afterward, each time you generate a report, you can select the template you want to use.
ProRankTracker will automatically style the report based on your customizations.
Insta-Check
If you’re working with clients, you’ll eventually get a question something like this:
“Hey, we’re thinking about targeting this new keyword, what do you think?”
What do you do in situations where your client wants a quick opinion or some quick information, but you don’t have any data on that keyword?
Insta-Check is a credit-based solution that lets you do quick SERP checks without using your monthly term limit. In other words, just pay for what you need, then save your leftover credits for future searches.
To make an Insta-Check report, just fill in the form with the information you want to check, then wait a minute or 2 for ProRankTracker to fetch the data from the SERPs.
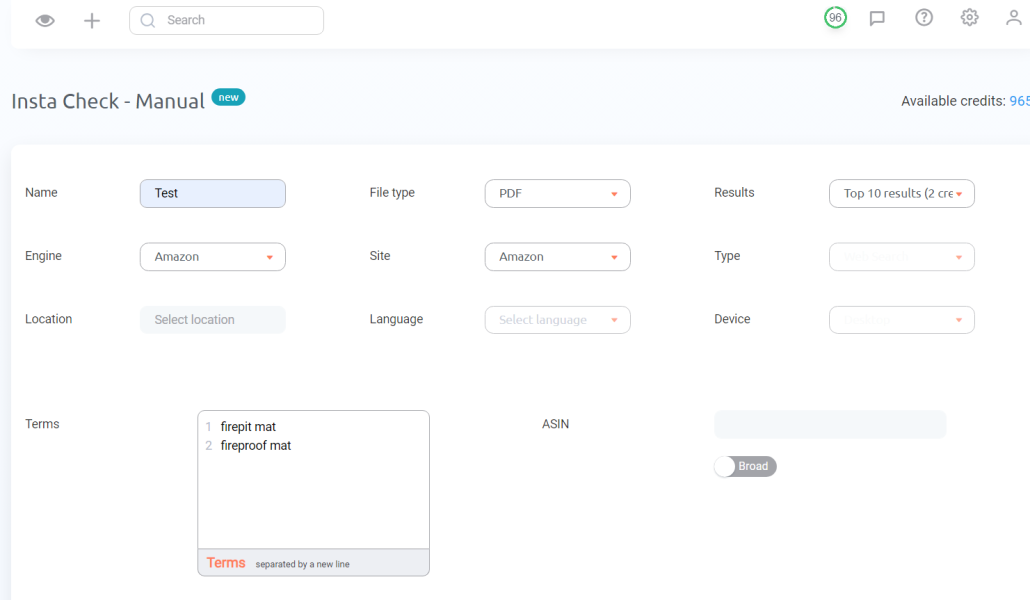
Voila!
You’re now the proud owner of a super fresh and 100% accurate report of the current SERP position for the keywords your client wanted to investigate.
You can repeat this process as many times per month as you need, replenishing your credits only when you run out.
How to Create the Perfect Ranking Report for Your Clients
Speaking of white-label reports, let’s discuss how to create the perfect SEO ranking reports for your clients.
Sure, you could send your clients a quick email to update them on their ranks, but that doesn’t look very professional and requires a lot more effort than it’s worth.
Instead, you should use white-label reporting templates like those offered by ProRankTracker. You can customize every aspect of these reports to make them EXACTLY like your clients want them.
Let’s talk about how to do just that.
Step #1: Understand Their Needs
The first step in creating the perfect ranking report is communication.
Before designing your report, communicate with your client to understand their needs. Every business is different, and their goals will vary.
When you communicate with your clients, ensure you get the following information from them:
- How often they want to receive ranking reports
- How involved they want to be in their SEO strategy
- Their preferred method of receiving ranking reports (email, live website, mobile application, etc.)
- What data is most important to them
Knowing this information allows you to set up their PERFECT reporting schedule.
Step #2: Collect and Add URLs and Keywords
Now that you’ve clearly communicated your client’s goals and needs, it’s time to prepare their ranking campaign on ProRankTracker.
Ask your client for a list of their current URLs and keywords, and then add them to your tracking list in PRT using the Add Wizard or Advanced Add tools.
Advanced Add would be faster in this scenario since it allows you to bulk-add.
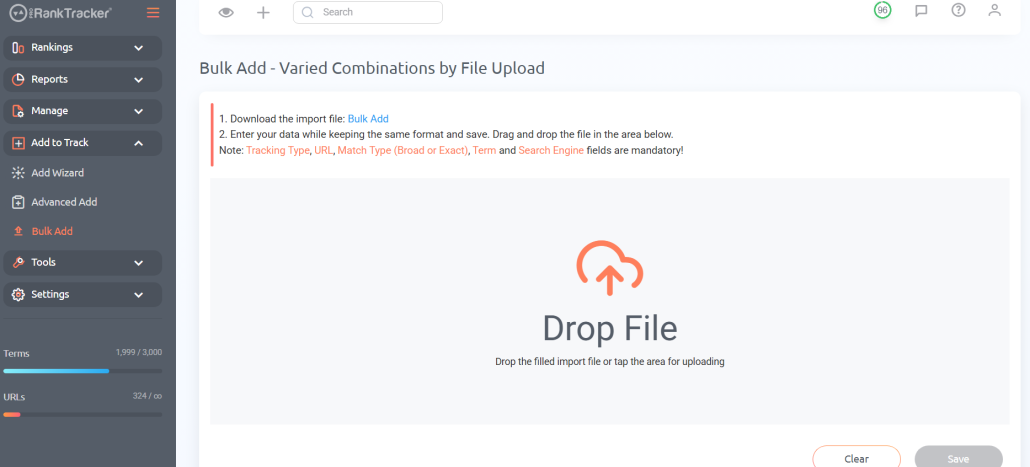
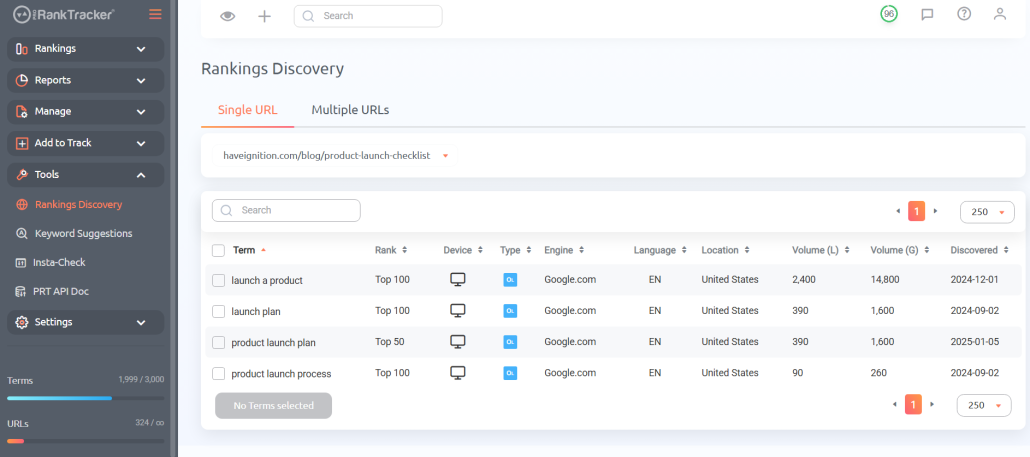
You can later research and improve your clients’ keyword strategy by using the other tools available on PRT like the Keyword Suggestions and Rankings Discovery tools, which both help you find new keywords highly relevant to your current strategy.
Step #3: Create Projects
Now that your clients’ SEO campaign is up and running on ProRankTracker, you can create a Project (or multiple Projects) that helps you keep track of their data.
Go to the Projects menu under the “Manage” tab and select “Add New Project.”
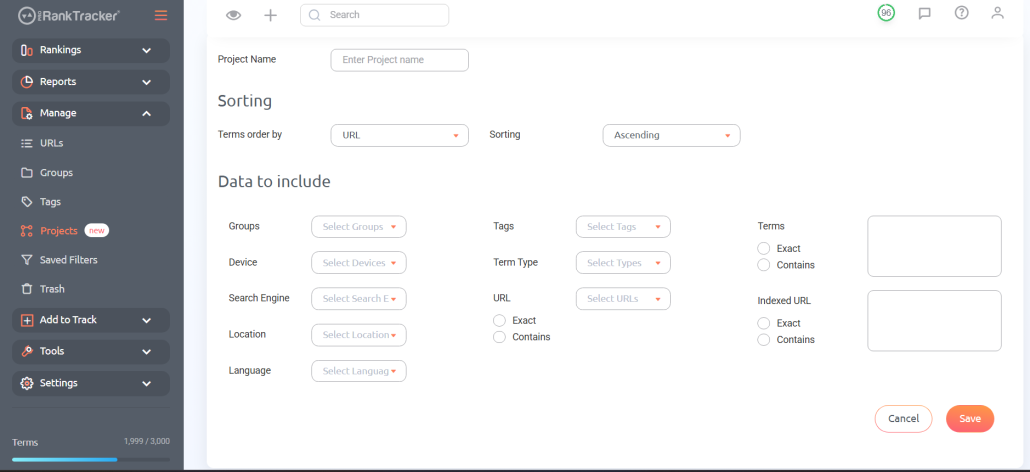
Here, you’ll select which tags, groups, URLs, and keywords you want to put in the Project.
When making a Project, consider your goals.
- Trying to separate clients’ data from each other? Make a Project per client
- Trying to split up your SEO campaign by location? Make a Project for each location.
- Want to understand how mobile and desktop results vary? Make a mobile Project and a desktop Project.
The point is to make the Project that fits your needs (there’s no limit to how many you can make), so use your creativity to drive you here!
Step #4: Customize Templates
We discussed templates earlier in this article, but let’s talk about why they’re important and where to find them in ProRankTracker.
You CANNOT ignore templates because they will save you a TON of time in customizing and designing your reports to send to clients.
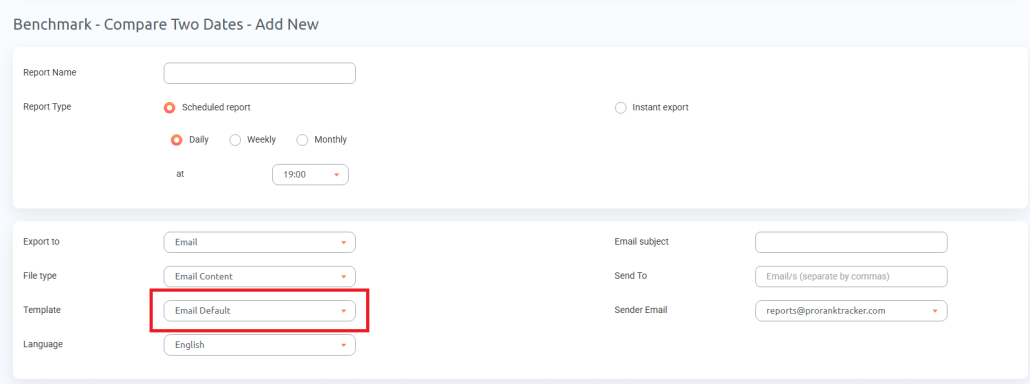
To create a template, click “Templates” under the “Reports” tab in the toolbar. Click “Add New Template,” then determine what you want your template to look like, including:
- Colors
- Text styles
- Header
- Footer
- Cover letter
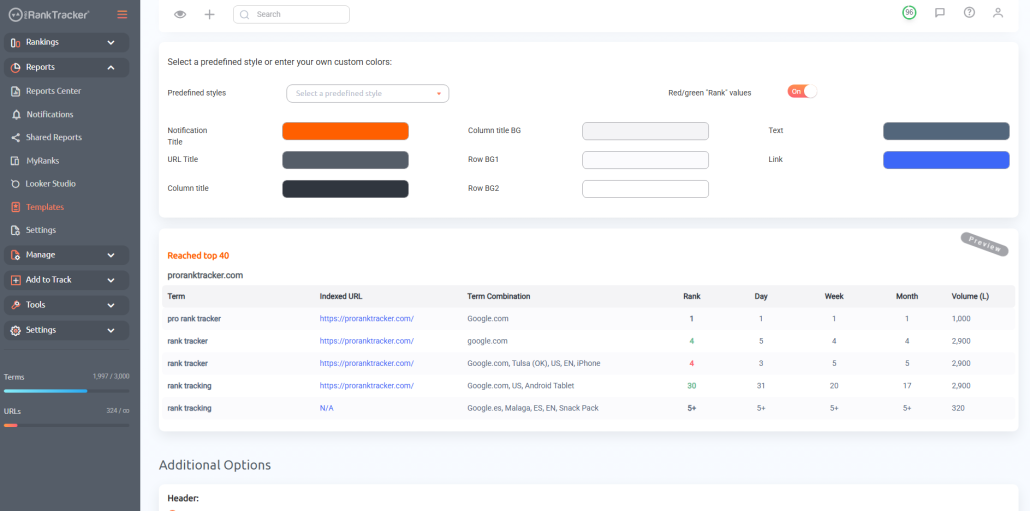
Again, you can create as many of these as you need, so you can create different styles for each client or even for each type of report for some extra pizzazz.
When you then go to create a new report, just select the template you want from your templates drop-down menu, and your style will automatically be applied to your report!
Step #5: Establish a Schedule
Based on the information you gathered from your client, you should be able to establish a slam-dunk reporting schedule.
Some clients will want daily reports. Others will be happy with weekly reports. Some may want 24/7 access to their ranks (we’ll talk about how to do that later in this article).
The main thing here is to tailor your reporting schedule to each of your client’s needs/wants.
Using an automated reporting tool like ProRankTracker, you should be able to set up a reporting schedule that’ll automatically send the appropriate reports at the correct times. This guarantees that you never miss a deadline, keeping the clients happy (and saving you time)!
Step #6: Customize Your Reports for Each Client
Your report should address each client’s unique needs. Communicate with them to ensure you have a firm grasp of what they expect each report to include.
Do they want all their campaigns in a single report, or do they want each campaign in its own report? Do they want to focus on specific geographic regions or certain search engines?
Every client is unique, and your report should reflect that. Instead of using generic reports for each client, customize your reports to provide an in-depth view of whatever they need most at the time.
ProRankTracker makes this easy. When you select a new report, you will automatically go to a page where you can customize EVERYTHING about that report:
- What data shows up and in which order
- What keywords/URLs to include in the report
- Language, search engine, location, and other local search factors
- Template design (as discussed above)
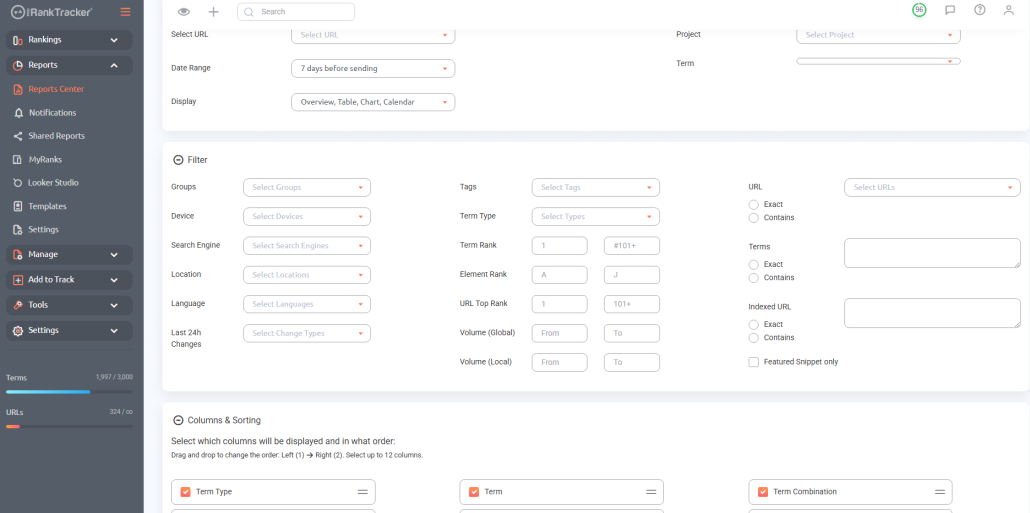
Not only should you be selecting a variety of reports to incorporate in your reporting schedule, but you should also be customizing the data that appears in each report to meet your client’s needs!
Step #7: Add Brand Customization to Every Report
Your client’s branding is essential. A report with no branding looks unprofessional and thrown together.
Conversely, customizing your reports with your brand not only makes them more attractive but also establishes rapport with your client.
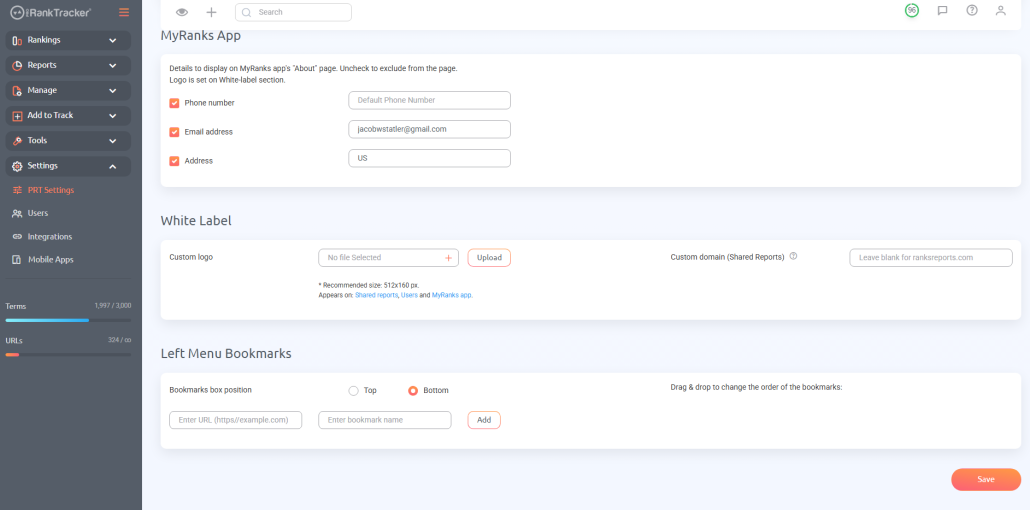
Ensure that each report contains your branding, logo, color scheme, and other customized elements. This will make your client feel that the report is coming directly from you, enhancing your credibility with your clients.
To add these customizations to your reports, go to your PRT settings, then click “White-Label” to change your white-label customization settings.
Step #8: Generate and Repeat
Now that you know how to create a STUNNING report on ProRankTracker, it’s time to get busy!
Generate the reports your clients need and set them to send on a recurring basis so your clients are constantly updated on their SEO progress.
Repeat this process as needed to create the perfect automated ranking schedule for each of your clients!
Why SEO Rank Reporting is so Important
If you can just open your SEO tool and check your ranks, do you need advanced reporting features?
YES, YES, and YES.
Automated SEO rank reporting is important for 3 main reasons:
- It saves a TON of time by keeping you from needing to go through all your data every day (just get it delivered to your inbox when you need it!)
- It gives you a deeper understanding of your data, which you can use to improve your SEO rankings
- It keeps you up to date all the time, meaning you’ll never miss a beat or get caught unawares by your competitors
Frequently Asked Questions About SEO Rank Reporting
How do I get an SEO report?
The best way to get an SEO report is by using a powerful rank-tracking tool like ProRankTracker or importing your data into Google Looker Studio. Make sure you tailor your report to your client’s needs to help them truly get the most out of your reports!
How do I track my SEO ranking?
Many people use all-in-one tools like Ahrefs, but a dedicated rank tracking tool is the best way to track SEO rankings. ProRankTracker is one such tool, and it guarantees daily ranking updates with extreme accuracy.
What is the best SEO report software?
If you’re using a tool like ProRankTracker, you can use its native white-label reporting features. If you want even more flexibility with your reports, use an API in combination with Google Search Console and Google Analytics to create powerful visual reports in Google Looker Studio.
The Beauty of Unlimited Reports
One of the best parts of ProRankTracker’s reporting abilities is that you can send unlimited white-label ranking reports to your clients.
Yep, UNLIMITED.
The truth of the matter is that you never know how many reports you might need to generate.
Having no limits to the number of reports you can generate gives you the freedom to experiment and your agency some serious scalability.
Ready to Start Generating SEO Rankings Reports?
With these reports at your fingertips, you’ll be able to identify areas of strength and weakness in your search rankings and make targeted changes that can help improve your results over time.
Whether you’re an SEO agency or just trying to stay on top of your own SEO, here’s a final piece of advice — don’t dismiss reporting when deciding which tool to use!
The right tool that includes generated reports makes your SEO easier, more effective, and more thorough.
Give several tools a try and see which one is right for you.
And there’s no better place to start than ProRankTracker’s 14-day free trial.
Happy reporting!






Trackbacks & Pingbacks
[…] The 11 types of SEO ranking reports you absolutely must know (+special premium features) […]
[…] The 11 types of SEO ranking reports you absolutely must know (+special premium features) The Amazing Value of White Label Solutions for SEOs […]
[…] The 11 types of SEO ranking reports you absolutely must know (+special premium features) […]
[…] I will be referencing PRT’s reporting solutions, so you should read up on our white label reports HERE). So here are a few things you can do before coming to the […]
Leave a Reply
Want to join the discussion?Feel free to contribute!