
How to Create a Google Data Studio SEO Report in 3 Steps
Have you ever struggled to organize your SEO data in a way that makes it easy to understand while still providing the depth you need to make sound strategic decisions?
We’ve all been there.
Crafting an SEO report that effectively communicates website performance, keyword rankings, and other critical KPIs is HARD but also incredibly important.
Fortunately, Google’s Looker Studio allows businesses to do just that. It gives users the power to create incredible data visualizations that expose the inner workings of their SEO progress. It also allows for the seamless integration of various data sources to improve its utility further.
But how do you use it?
This article will show you how to generate powerful Google Looker Studio reports that help you understand your SEO data and climb the SERPs.
Let’s get started!
We’ll cover:
- Key Performance Metrics (KPIs) to Include in an SEO Report
- Step 1: Add Data Source
- Step 2: Build Your Report
- Step 3: Create a Reporting Plan
- Why ProRankTracker Is the Perfect Google Looker Studio Companion
- FAQ
Key Performance Metrics (KPIs) to Include in an SEO Report
Before we jump into how you can create a powerful report using Google Looker Studio, let’s discuss what data those reports should include.
After all, putting the wrong data on your SEO reports could waste your time without providing actionable information.
That’s what we’re trying to avoid!
If you want an SEO report to be truly effective, it should include specific KPIs (key performance indicators) that give you the most precise idea of how effective your current SEO strategy is.
Let’s discuss which KPIs deserve a spot in your SEO reporting strategy.
Ranking Data
Keyword rankings indicate where your pages rank when searching for keywords or phrases related to them on search engines.
For example, if someone searches “state parks near me,” what position does your local state park’s page show up in?
The higher up a page appears in SERP rankings for specific keywords or phrases related to it, the better its chances of being clicked on by users—which drives organic traffic to your site!
If you don’t have hard data about WHERE your pages rank on the SERPs, you are totally blind as to how to improve your ranks going forward (which is the whole point of SEO!).
Organic Traffic Data
Traffic volume is one of the most important KPIs to consider when it comes to SEO viability.
In other words, how many people are landing on your site from the Google SERP (not including other sources like paid traffic, social referrals, etc)?
The higher your traffic volume, the more visibility your blog has on search engines.
If you’re serious about growing your business, you HAVE to know how many people visit your site and HOW they discovered your site. Having in-depth knowledge about your organic traffic data lets you know where to focus your efforts in the future to maximize traffic and, therefore, sales.
Page Performance Data
Another set of critical KPIs that you should include in your Google Looker Studio reports are details about your page’s performance data, such as bounce rate, click-thru rate (CTR), and time on site. Let’s quickly look at why these 3 metrics are important to follow:
- Bounce rate refers to whether a customer engages with your site in any way before “bouncing” off to another page. A high bounce rate indicates that people aren’t finding what they need when they visit your page; conversely, a low bounce rate means people are engaging with your content.
- CTR tells you how often people click on the link to your site when it appears on their Google SERP (an impression). If you’re getting tons of impressions but few clicks, it likely means that your content isn’t matching search intent, and you may need to refocus on different keywords.
- Time on site tells you how much time a user spends on each page or post before leaving your website. This metric will help you determine whether visitors engage with your content, which can help you design and write better content going forward.
Conversions
Conversion rate is the most important KPI because it measures how successful your website is at converting visitors into customers.
In other words, it measures sales resulting from visits to the site.
If visitors are clicking away without buying anything or engaging with any pages beyond their first click-through, this could indicate a deep problem with your website, such as:
- Low trustworthiness (which can also affect your ranking)
- Poor design elements
- Clunky UI, making it difficult to navigate the site
- Search intent mismatch
Including conversion rates in your SEO reports will give you insight into whether users are actually taking action after landing on your site, which can help inform future content and site development.
Step 1: Add Data Sources
A compelling SEO report combines data from multiple tools into a single visualization.
But what sources should you tie into your Google Looker Studio to ensure your reports are as powerful as possible?
In general, you should pull your data from as many sources as possible, but there are a few you should never go without.
Let’s discuss what data sources you NEED to include in your Google Looker Studio reports.
ProRankTracker
ProRankTracker is a rank-tracking tool that helps users keep track of all their most important SERP ranks. Connecting this tool to Google Looker Studio lets you use your ProRankTracker data within Google Looker Studio.
To add ProRankTracker as a data source in Google Looker Studio, your first step is to create a Looker Studio Report in ProRankTracker with a unique Looker ID (located under the Reports tab on the left-hand toolbar).
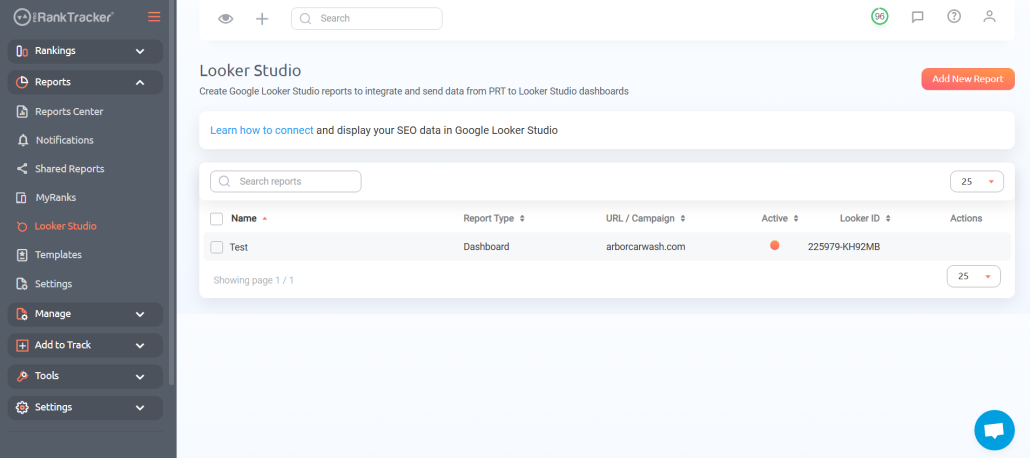
Second, go to the Integrations section of ProRankTracker, then select the desired premade report.
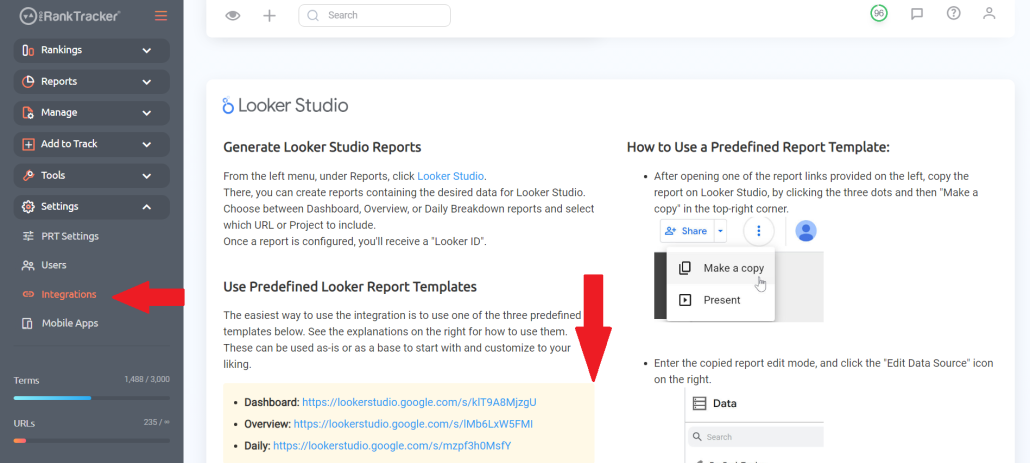
You’ll be taken to the premade report template. Remember that this is just a template, so it doesn’t include your personal data yet. To add that data, click “Make a Copy.”
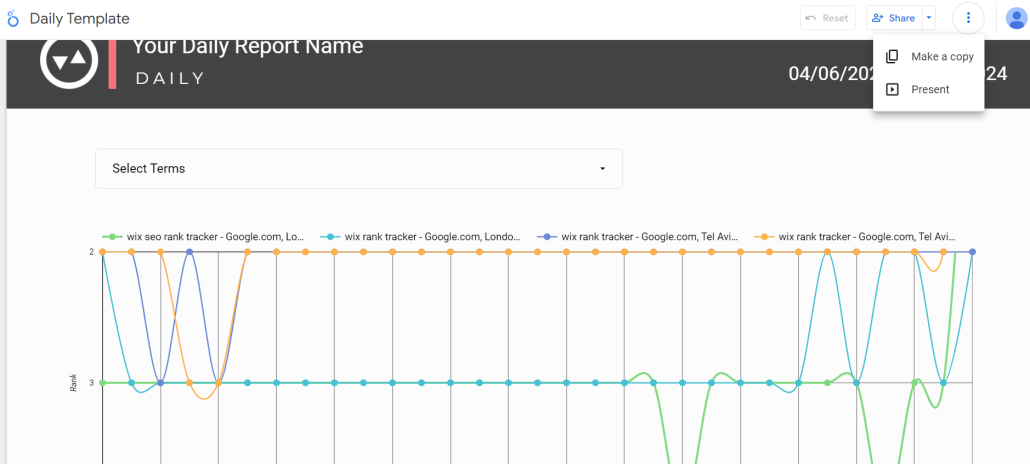
Now, click “Add data” in the report toolbar.
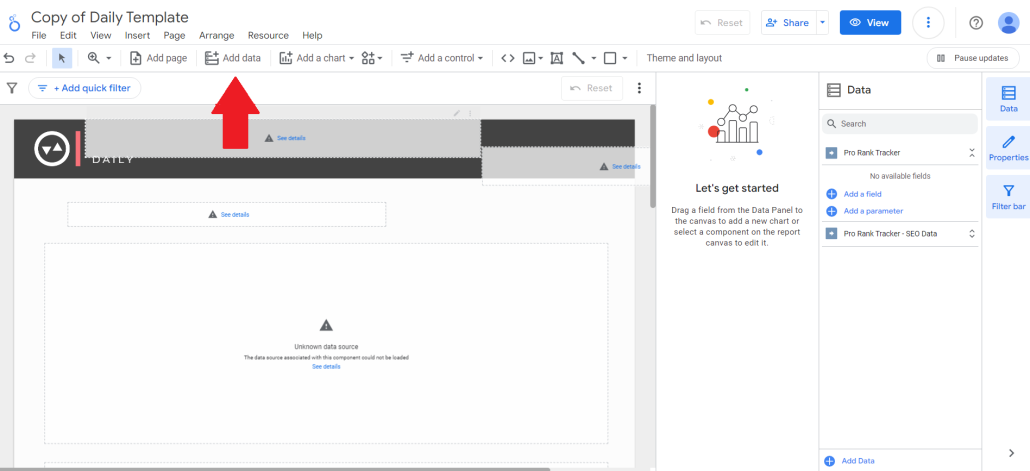
You’ll now be prompted to select from Google Looker Studio partners. Simply type in ProRankTracker and select ProRankTracker as your data source.
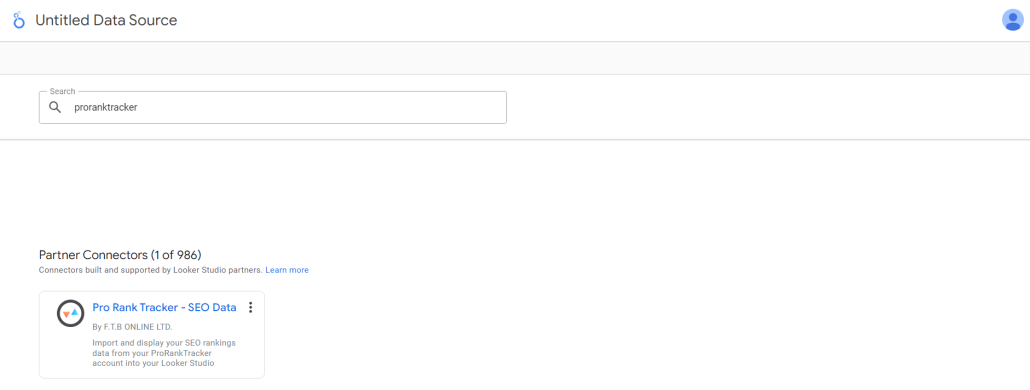
After selecting ProRankTracker to connect it as a data source, copy and paste the ID code from the first step into the appropriate slot.
The ProRankTracker report you generated within the ProRankTracker app will now appear within Google Looker Studio.
Google Analytics
Google Analytics is essential for understanding user behavior and analyzing the impact of SEO on overall website traffic.
Linking Google Analytics to your Data Studio report gives you essential metrics like organic sessions, bounce rate, session duration, and goal conversions.
This data paints an incredibly valuable picture of how users find and engage with your website. Paired with ranking data from ProRankTracker, it provides insights into which keywords and pages drive the most valuable traffic.
For example, with both ProRankTracker and Google Analytics in your report, you can pinpoint keywords that have discrepancies between their rankings and the traffic they produce. Knowledge like this can SERIOUSLY impact how you prioritize future SEO efforts.
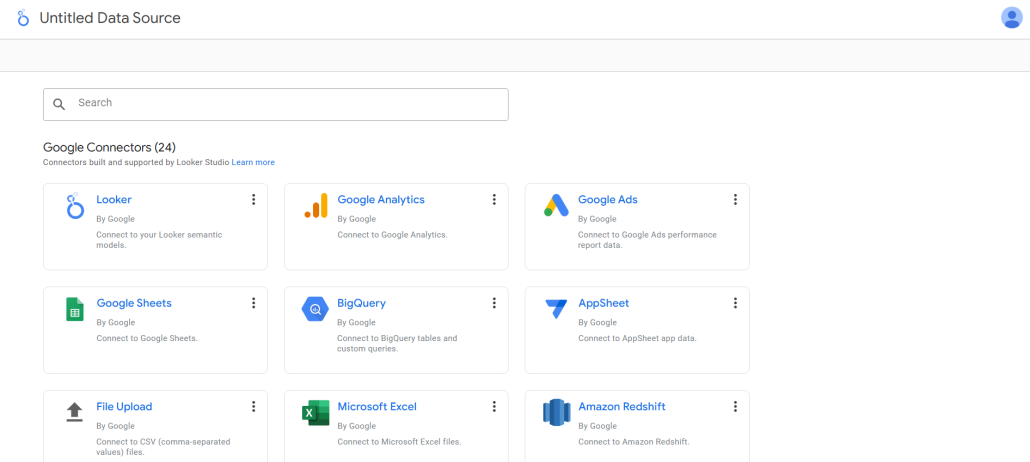
To add Google Analytics to your Google Looker Studio data sources, just click the “Create” button, then click “Data Source” and select Google Analytics from the list.
Google Search Console
Google Search Console provides unique insights into your website’s search visibility on Google.
It includes crucial data on:
- Keyword impressions
- Clicks
- CTR
- Details about which keywords are driving traffic to your site
Integrating Google Search Console with Google Data Studio provides a powerful look at keyword visibility beyond ranking. It shows which terms are generating the most engagement and identifies opportunities to improve CTR for high-impression keywords.
Similar to Google Analytics, the power of Google Search Console is amplified by combining it with other tools like ProRankTracker and Google Looker Studio. For example, it might help you compare your CTR with your ranks without needing to jump back and forth between the two tools.
These insights can only be obtained by using a combined reporting system like Google Looker Studio that shows you details from multiple data sources on the same page.
You can connect Google Search Console to Google Looker Studio in the exact same way you connected Google Analytics since there is a built-in integration.
Other SEO Tools
You probably use other SEO tools in addition to the ones mentioned above. Connecting those SEO tools to Google Looker Studio can also add value to your SEO report.
For example, SEMrush and Ahrefs offer deep insights into keyword competition, backlink profiles, and technical SEO. Integrating their data with Google Looker Studio and the other tools you integrate with it adds depth and completeness to your reports that you can’t find anywhere else.
There are 2 ways to check if a tool is compatible with a Google Looker Studio integration:
- Check the built-in integrations in the “Data Sources” menu in Google Looker Studio shown above.
- Check your tool’s documentation to see if you can connect it with Google Looker Studio using an API (this method requires some technical know-how).
Each tool you add to Google Looker Studio provides a unique perspective on your data, allowing you to create a more thorough SEO report.
In other words, you should investigate the compatibility of ALL your SEO tools with Google Looker Studio–the more you add, the more complete your understanding of your SEO will be.
Step 2: Build Your Report
Now that your data sources are connected, it’s time to start building the report itself.
A lot goes into creating a perfect Google Data Studio SEO report:
- Design
- Data completeness
- Ease-of-use
Selecting the right templates, visualizations, and layouts allows you to create an intuitive and visually appealing report. More importantly, it ensures that you get the most benefit from your reports by making your data accessible.
Let’s talk about how to create the perfect Google Looker Studio report.
Select Data Sources
When you create a new report in Google Looker Studio, you’ll be prompted to select all the data sources that you want to use in that report.
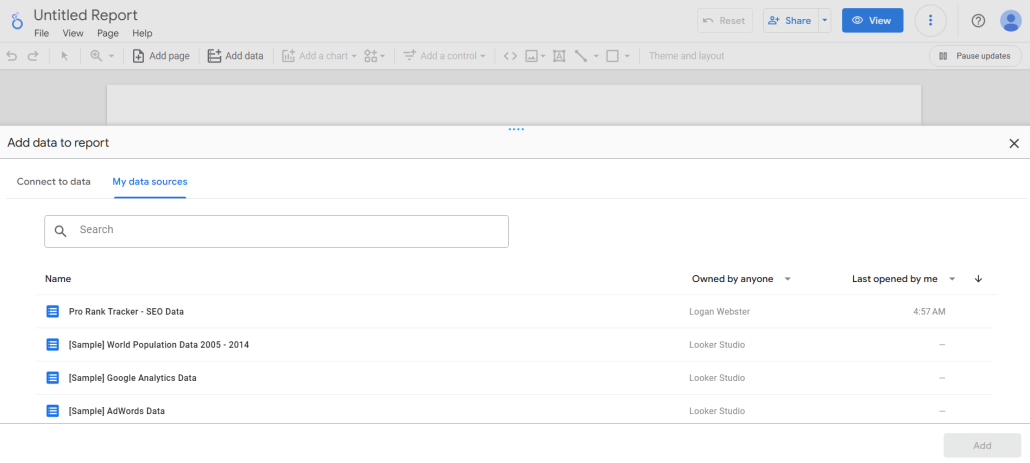
After selecting your first data source, click “Add.” If you want to add more data sources to your report (we highly recommend creating at least some reports that blend data from multiple sources), click the “Add Data” button on the toolbar at the top of your report.
The most important thing is to carefully consider which data sources allow you to accomplish what you need for that report.
Need a report that helps you understand the relationship between keyword ranking and CTR? Try combining Google Search Console and ProRankTracker.
Think about what you need a report to tell you, then add the data sources to help you accomplish that goal.
Select a Template or Design Your Layout
There are two ways to get the perfect design in a Google Looker Studio dashboard:
- Create a report from scratch
- Find a premade report and modify it to your liking
Creating a report from scratch can be very time-consuming, but it also gives you the most control over the final product.
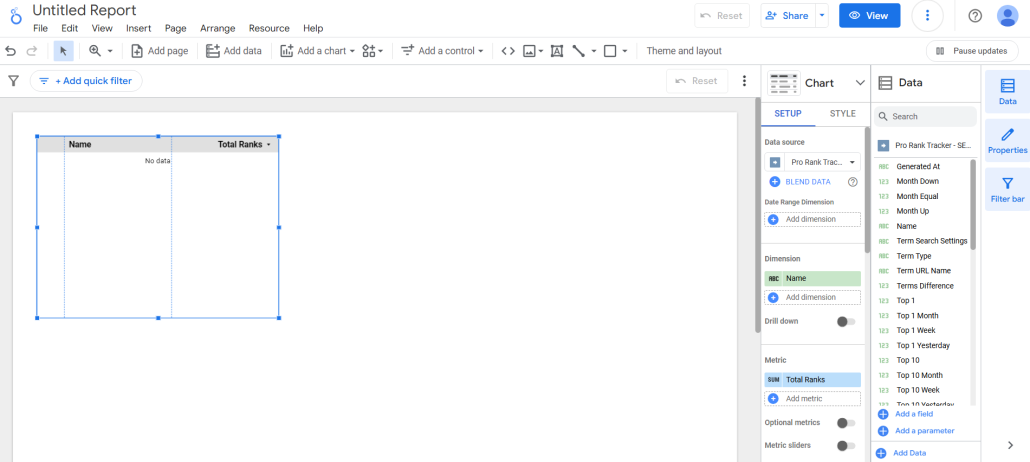
The best way to create a custom Google Looker Studio dashboard is to use one of the ProRankTracker premade report templates we discussed above as a starting point and add whatever you want to it.
Your creativity is the only limit to what you can do in Google Looker Studio. Here are a few examples of things you can do to help get you started:
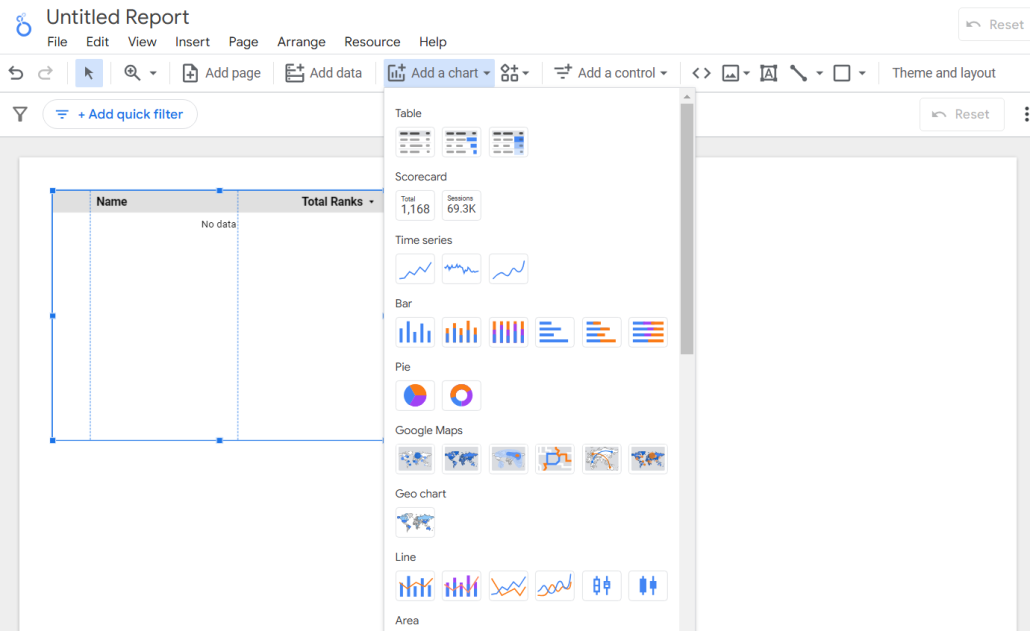
- Add tables, charts, or graphs
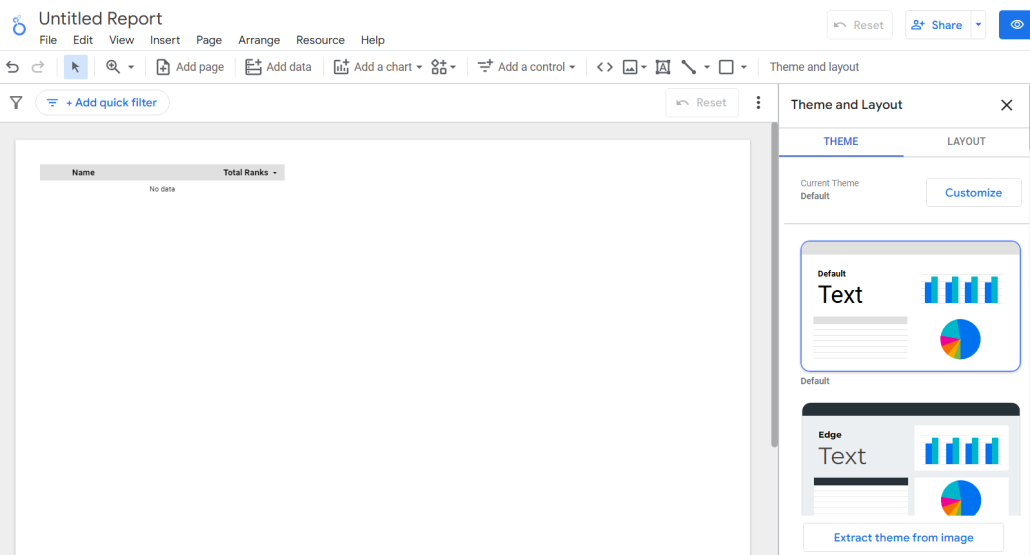
- Change the theme/layout
- Add additional data sources (discussed above)
- Customize the report with your colors and logo (this is especially important if you’re an SEO agency trying to impress your clients)
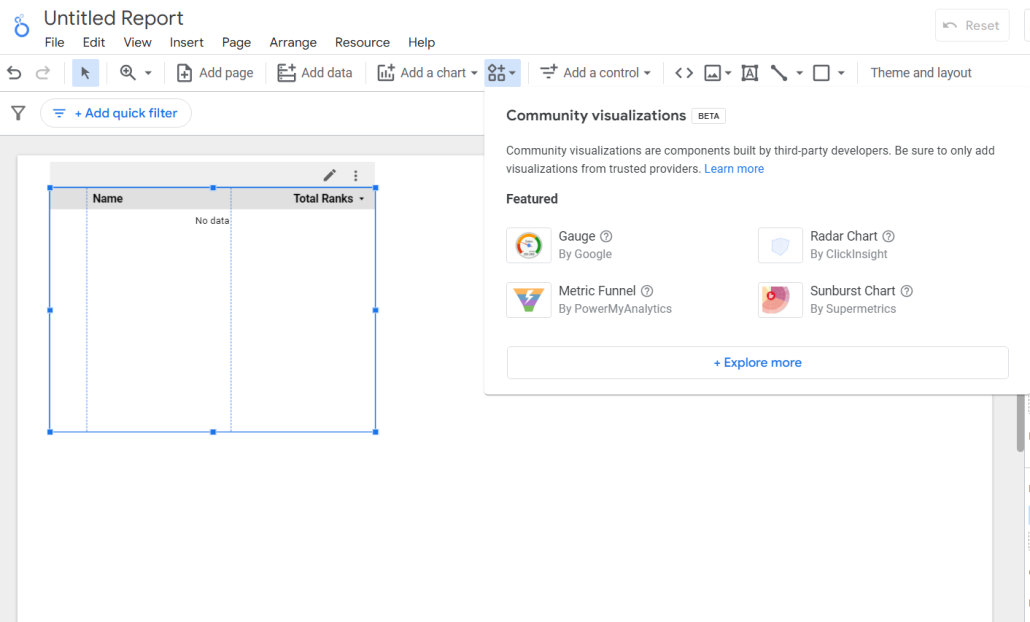
- Add third-party visualizations
I’m not going to sugarcoat it–Google Looker Studio can be daunting at first because it’s such a massive tool. I recommend clicking around to get a feel for it and watching YouTube videos whenever you have a question about accomplishing a certain goal in the software.
Select Data Visualizations
We briefly mentioned visualizations in the previous section, but let’s spend more time discussing what you can accomplish with them.
TONS of visualizations have been created by other Google Looker Studio users like you, and they’re now available for free.
To use them, click on the visualizations box.
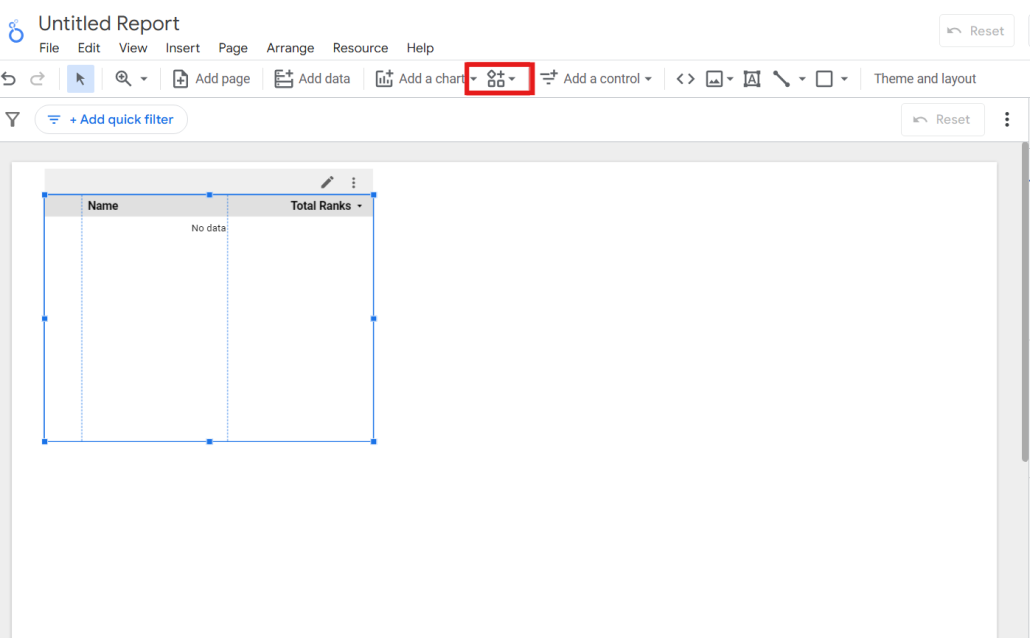
Then click “Explore More.”
You’ll see a huge list of third-party visualizations that allow you to accomplish nearly anything in Google Looker Studio.
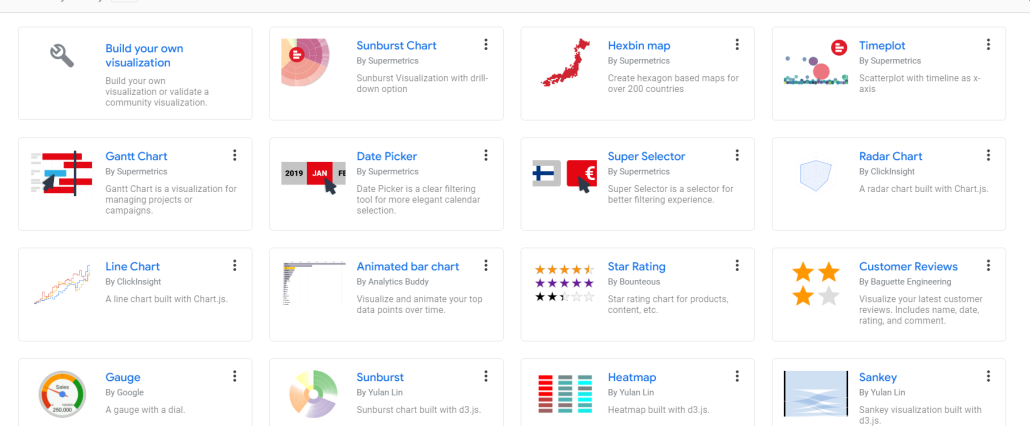
For example:
- Visualizations to help you see traffic based on location
- Visualizations that aggregate customer reviews
- Candlestick charts, histograms, and other statistical tools
If you can’t find something to do exactly what you want, you can also make your own visualizations from this menu, giving you the ultimate freedom to accomplish whatever you want in Google Looker Studio.
Step 3: Create a Reporting Plan
Reports are really only helpful if you don’t have to generate them CONSTANTLY.
Automated reporting schedules are crucial to ensure reports are regularly generated and delivered to you or your clients WITHOUT you having to lift a finger.
Instead, you want them to pop up in your inbox at the perfect time every day/week/month.
Now that you know how to create an awesome Google Looker Studio report, it’s time to put those reports to work for you.
Here’s how:
- Strategize to come up with ALL the reports you think you need to completely understand your SEO (also considering reports from other sources like ProRankTracker).
- Create said reports.
- Adjust the schedule on those reports to make them automatically dispatch to your email at the appropriate time and date on a recurring schedule.
In Google Looker Studio, you can schedule a report by clicking on the tiny arrow next to the “Share” button and then clicking “Schedule Delivery.”
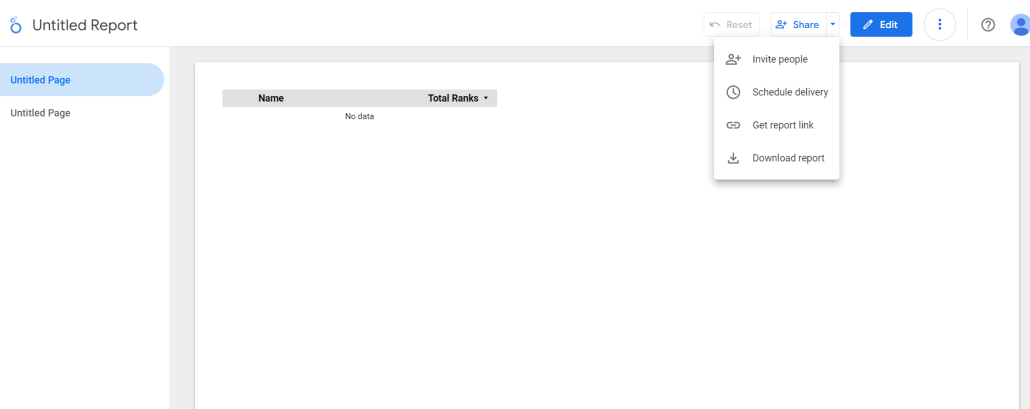
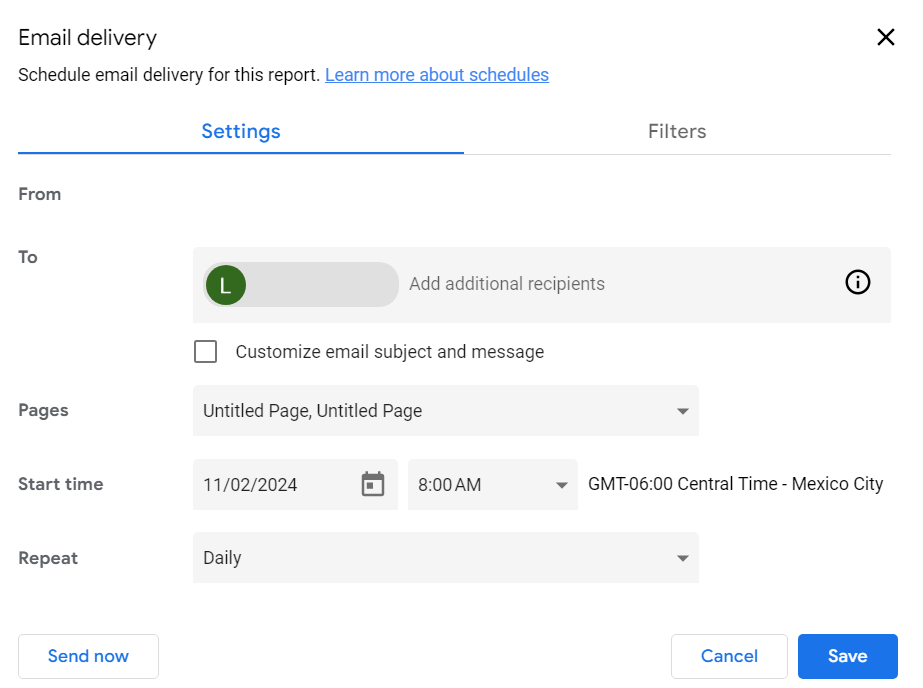
Finally, specify the automated report’s recipients, time, dates, and schedule. This will ensure that the right people get the report at the right time without any additional effort on your part.
Why ProRankTracker Is the Perfect Google Looker Studio Companion
What do you do when Google tools no longer provide you with all the data you need?
Whether you need more detail about your ranks or more depth on your competitors’ keyword strategies, this is where ProRankTracker comes into play.
We talked about this briefly above, but let’s go into a little more detail about how to combine the power of ProRankTracker with Google Looker Studio.
When it comes to tracking ranks, ProRankTracker is one of the most powerful tools available.
Better yet? It integrates seamlessly with Google Looker Studio, making it easy to increase the utility of both tools.
Let’s explore the specific benefits that make ProRankTracker an ideal companion to Google Looker Studio.
Quick Integration
One of the significant reasons ProRanktracker is an invaluable partner to Google Looker Studio is that they integrate so easily.
ProRankTracker can link with Google Looker Studio on ANY ProRankTracker plan (comes with Pro & Agency plans but is available as an add-on for smaller plans).
In addition, you don’t have to have any technical know-how to integrate your tools. Since there is a pre-existing integration, all you have to do is follow the steps laid out in the ProRankTracker integrations menu.
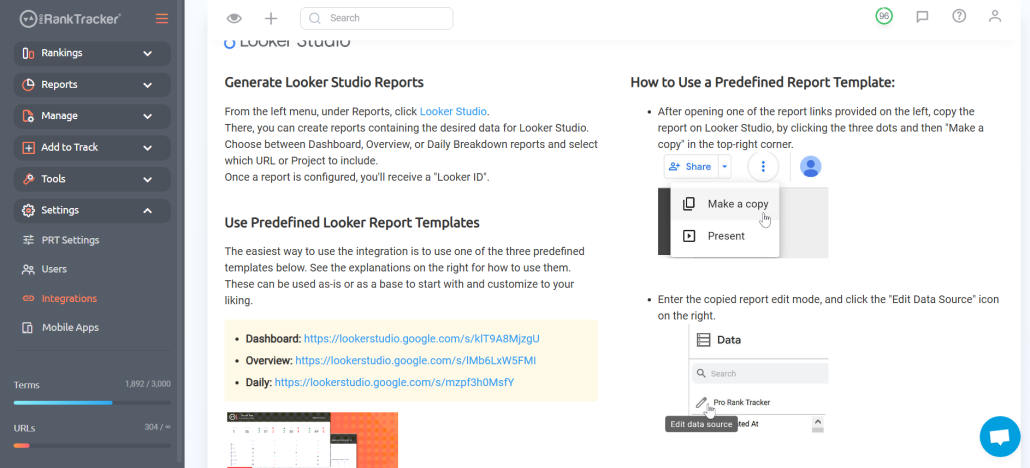
Integrating ProRankTracker with Google Looker Studio allows you to look at your ProRankTracker data in the powerful visualizations on Google Looker Studio. You can also create visualizations that combine your ProRankTracker data with data from other sources (like Google Analytics, Google Search Console, and other SEO tools).
Data Updated Daily
Data that’s updated daily is crucial for staying on top of ranking fluctuations and making timely decisions.
For instance, if one of your primary keywords starts trending downward, the daily data update allows you to quickly catch the issue, making it easier to pinpoint potential causes (e.g., algorithm updates, competitor strategy changes, or technical issues).
ProRankTracker provides daily rank updates on EVERY plan (even the cheapest ones!), ensuring that your reports reflect the most current SEO progress and allows you to monitor sudden changes or trends.
When combined with Google Looker Studio, ProRankTracker’s daily updates mean that you will ALWAYS have hyper-fresh data visualizations that you can use to make the very best strategic decisions for your business.
Built-in Customizable Reports
Google Looker Studio reports and visualizations are highly valuable tools, but they aren’t the only source of high-quality reports.
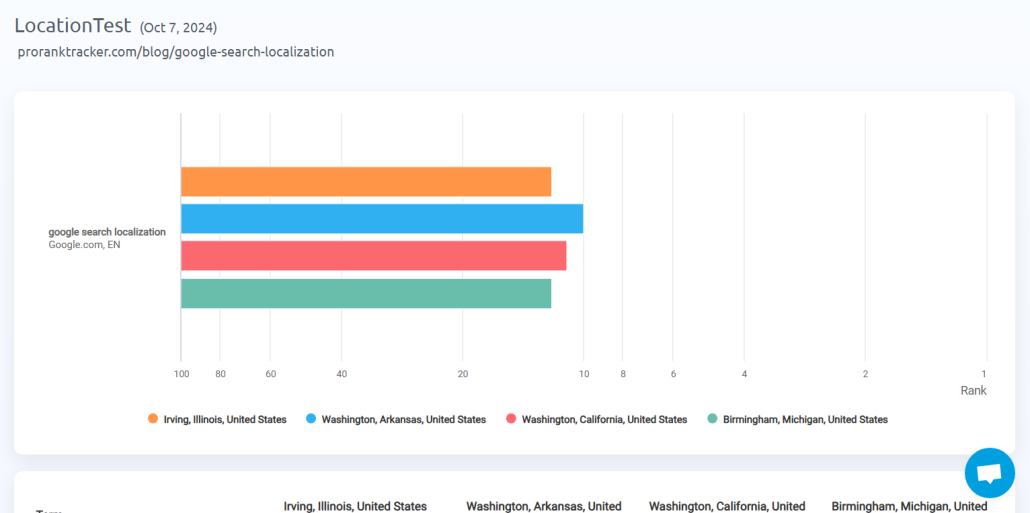
ProRankTracker provides more than 20 built-in reports that can be customized according to your needs (or the needs of your agency clients). For example:
- Historical reports
- Project summary reports
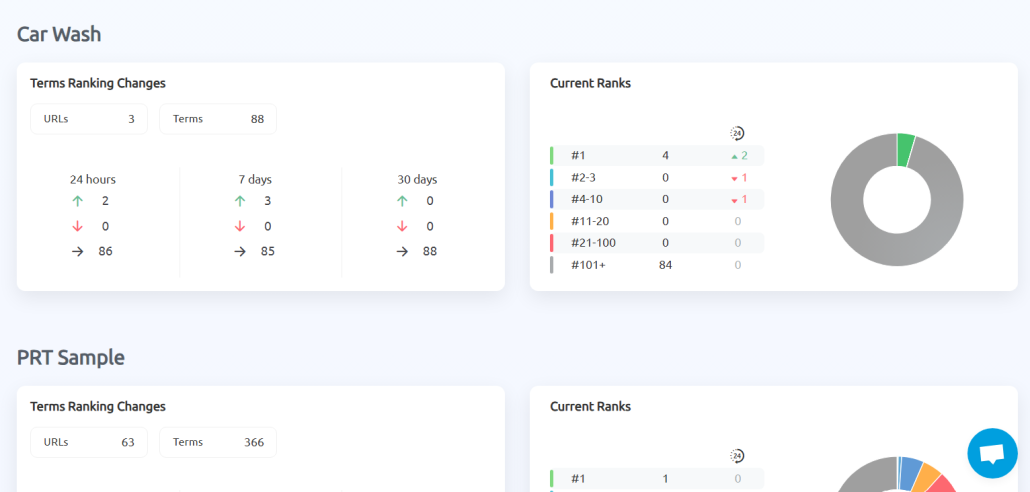
- Comparison reports
- Notifications
In other words, ProRankTracker allows you to create a fully functional reporting strategy in its own platform, freeing you up to use Google Looker Studio for things only it is capable of doing.
ProRankTracker’s built-in reports can save you time, allow you to use Google Looker Studio and your other tools more efficiently, and stay on top of your data more effectively.
You’ll be a force to be reckoned with once you combine these powerful reports with the incredible visualizations offered by Google Looker Studio.
FAQ
How do I get SEO reports from Google?
Both Google Analytics and Google Search Console can be combined with Google Looker Studio to create reports and data visualizations. However, using third-party SEO tools like ProRankTracker can improve your SEO reports with more information.
How do I create an SEO progress report?
First, determine which KPIs you want to include in your report, then select the tool that allows you to include those KPIs in a report. You can create SEO progress reports using a tool like Google Looker Studio or using the native reports feature in ProRankTracker.
How do I create an SEO report in Data Studio?
Creating an SEO report in Google Looker Studio can be difficult and takes some practice, but anyone can learn how. I recommend starting by looking for premade reports (like those offered by ProRankTracker) or researching the various data visualizations that are available in Google Looker Studio.
Conclusion
There’s no way around it–data drives EVERYTHING in SEO.
The more accessible your data, the better your strategic decisions will be.
Following the steps outlined in this article, you should be able to create truly powerful SEO reports using Google Data Studio in combination with your other SEO tools.
Good luck!

